EE 101 Lab 3 AC signals and scope
advertisement
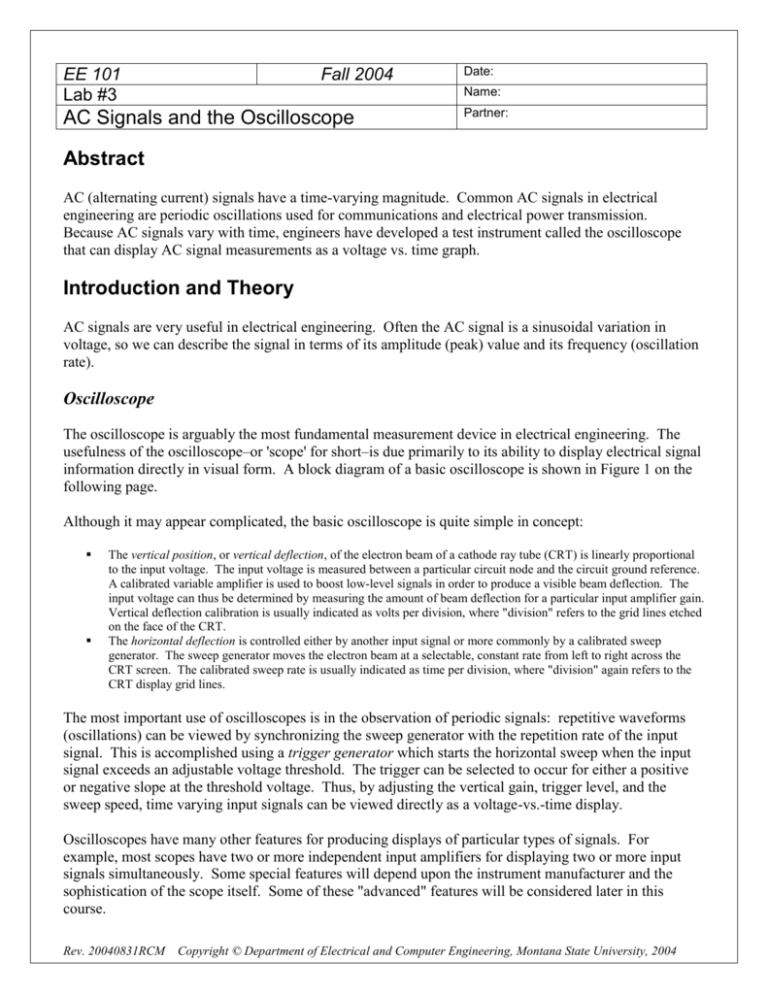
EE 101 Lab #3 Fall 2004 Date: Name: AC Signals and the Oscilloscope Partner: Abstract AC (alternating current) signals have a time-varying magnitude. Common AC signals in electrical engineering are periodic oscillations used for communications and electrical power transmission. Because AC signals vary with time, engineers have developed a test instrument called the oscilloscope that can display AC signal measurements as a voltage vs. time graph. Introduction and Theory AC signals are very useful in electrical engineering. Often the AC signal is a sinusoidal variation in voltage, so we can describe the signal in terms of its amplitude (peak) value and its frequency (oscillation rate). Oscilloscope The oscilloscope is arguably the most fundamental measurement device in electrical engineering. The usefulness of the oscilloscope–or 'scope' for short–is due primarily to its ability to display electrical signal information directly in visual form. A block diagram of a basic oscilloscope is shown in Figure 1 on the following page. Although it may appear complicated, the basic oscilloscope is quite simple in concept: The vertical position, or vertical deflection, of the electron beam of a cathode ray tube (CRT) is linearly proportional to the input voltage. The input voltage is measured between a particular circuit node and the circuit ground reference. A calibrated variable amplifier is used to boost low-level signals in order to produce a visible beam deflection. The input voltage can thus be determined by measuring the amount of beam deflection for a particular input amplifier gain. Vertical deflection calibration is usually indicated as volts per division, where "division" refers to the grid lines etched on the face of the CRT. The horizontal deflection is controlled either by another input signal or more commonly by a calibrated sweep generator. The sweep generator moves the electron beam at a selectable, constant rate from left to right across the CRT screen. The calibrated sweep rate is usually indicated as time per division, where "division" again refers to the CRT display grid lines. The most important use of oscilloscopes is in the observation of periodic signals: repetitive waveforms (oscillations) can be viewed by synchronizing the sweep generator with the repetition rate of the input signal. This is accomplished using a trigger generator which starts the horizontal sweep when the input signal exceeds an adjustable voltage threshold. The trigger can be selected to occur for either a positive or negative slope at the threshold voltage. Thus, by adjusting the vertical gain, trigger level, and the sweep speed, time varying input signals can be viewed directly as a voltage-vs.-time display. Oscilloscopes have many other features for producing displays of particular types of signals. For example, most scopes have two or more independent input amplifiers for displaying two or more input signals simultaneously. Some special features will depend upon the instrument manufacturer and the sophistication of the scope itself. Some of these "advanced" features will be considered later in this course. Rev. 20040831RCM Copyright © Department of Electrical and Computer Engineering, Montana State University, 2004 3-2 Sweep Rate Selector Dial (Trigger Pulses) Sweep Generator (Horizontal Sweep Signal) Trigger Level Selector Dial Trigger Generator Horizontal Amplifier Input Vertical Amplifier Oscilloscope Display "Ground" Reference Gain Selector Dial (Sensitivity) Figure 1: Block Diagram of a Basic Oscilloscope 3-3 Capacitors Capacitors are electrical circuit elements that can store temporarily an electrical charge. The amount of charge stored depends on the size (capacitance) of the capacitor. The capacitance is measured in farads: coulombs (charge) divided by volts. Typical capacitors found in the lab might be 1.0 microfarads (10-6 farads), or 0.1 microfarads, or 0.001 microfarads. The schematic circuit symbol for a capacitor looks like + or like if the capacitor is polarized, meaning that the component must be placed in the circuit with a specified polarity. Capacitors are frequently labeled with a three digit code that is somewhat similar in format to the code for resistors. Referring to the three digit sequence as ABD, the nominal value of the capacitor is given by A:B x 10D in picofarads (pF). For example, the label "103" (A=1, B=0, D=3) would mean 10 x 103 pF, or 0.01 F (microfarads). The three digit nominal value code is usually followed by a letter, which is used to indicate the tolerance of the capacitance value. Common tolerance indication letters are: M=20%, K=10%, J=5%, G=2%, F=1%, and E=0.5%. Recall that the tolerance refers to what range of actual (measured) capacitance is expected for the particular device, expressed as a percentage of the nominal value. For example, if a capacitor is labeled “103K”, that means its capacitance will be somewhere in the range 0.01 F 10%, or between 0.009 F and 0.011 F. Some capacitors (e.g., aluminum electrolytic devices) are physically large enough that they have the capacitance printed directly on the case without using the three digit code. Applications of capacitors include using them in circuits, along with resistors, to create electrical filters. Filters will tend to reduce the amplitude of electrical signals in selected frequency ranges. Thus, the output signal from a filter circuit that is supplied by a sinusoidal input signal will have amplitude that depends on both the amplitude and frequency of the input signal. For example, a frequency-selective filter is found in a radio “tone” control: adjusting this control can cause an increase in the level of bass (low frequency) sounds relative to high frequency sounds, or vice versa. In this experiment you will explore the characteristics of simple lowpass filters made using one resistor and one capacitor. At low frequencies, the capacitor will have sufficient time to become “charged” with one polarity as the current flows through the circuit during one half cycle of the sinusoidal input signal, and then discharged and recharged in the opposite polarity during the next half cycle. The output voltage will therefore be about as large as the input signal. But at very high frequencies, the period (cycle duration, 1/frequency) of the input signal is so short that the capacitor cannot charge or discharge before the next cycle of the waveform. This means that the output voltage amplitude is expected to decrease as the input frequency increases. Equipment Your circuit prototype board, your lab kit (containing resistors, resistor color code chart, potentiometer, capacitors, and alligator clips), and the bench power supply, function generator, oscilloscope, DMM, and banana cables furnished in the lab. 3-4 Procedures P1. → As a first step, use the potentiometer from your lab kit and your prototype board to construct the circuit shown below. Use the DMM to set the bench power supply to 10 volts. 10 V to DMM (black) and scope ground Potentiometer + - to DMM (red) and scope CH1 → Turn the potentiometer screw to place the wiper somewhere between the extremes. Connect both the DMM and the oscilloscope (CH1, DC coupling) to measure the voltage between the wiper (pin 2) and ground (pin 3). Since the signal is constant, the scope should display a horizontal line with the amount of vertical deflection equal to the constant voltage. Compare the DMM voltage reading and the measurement using the oscilloscope for several different positions of the potentiometer screw. Comment on the degree to which the two DC measurements (DMM and scope) match each other. P2. → Turn on the function generator and use the control knobs to produce a 1 kHz (1000 Hz) sinusoidal waveform. Using a BNC-to-alligator cable, connect the oscilloscope probe tip to the red lead from the function generator and the probe's ground clip to the black lead. Adjust the oscilloscope amplitude knob and sweep rate knob until you see about one cycle of the sinusoidal waveform on the screen. → Measure the period of the waveform (horizontal time required for one cycle) and its peak-to-peak amplitude. Waveform Period: Peak-to-peak Amplitude: P3. → Adjust the function generator frequency and scope sweep rate so that exactly two cycles of a triangle waveform fit across the display screen. Then adjust the function generator amplitude—observing 3-5 with the oscilloscope—so that the triangle waveform is exactly 3V peak to peak. Record the scope settings. Scope Vertical Gain Setting (volts/division): Scope Horizontal Sweep Setting (time/division): P4. → Construct the simple resistor-capacitor (RC) network shown below using your prototype board, and set the function generator to be a 2 volt peak-to-peak sinewave. Vin: To scope CH1 Vout: To scope CH2 R = 1 k C = 0.1 F 2 V p to p To scope ground → Use the two channels of the oscilloscope to display the input voltage waveform (CH1) and the output voltage waveform (CH2) simultaneously. Figure out a way to find the delay (lag) of the output compared to the input. Take a set of measurements to fill out the table below. Input Frequency Vin Amplitude (set 2V p-to-p) VOUT Amplitude (peak-to-peak) Time Delay (output vs. input) 500 Hz 1 kHz 2 kHz 5 kHz 10 kHz 20 kHz 50 kHz 100 kHz This circuit is called a lowpass filter. Based on your measurements, explain in words why you think the term lowpass makes sense. Remember: You need to do the next two soldering steps for you robot printed circuit board before you get to lab next week. Follow the instructions in the “Assembling the ECEbot: Part Two” guide book for steps 3 and 4.
