Composite Pattern AM Demodulation Using Bandpass Filtering and
advertisement
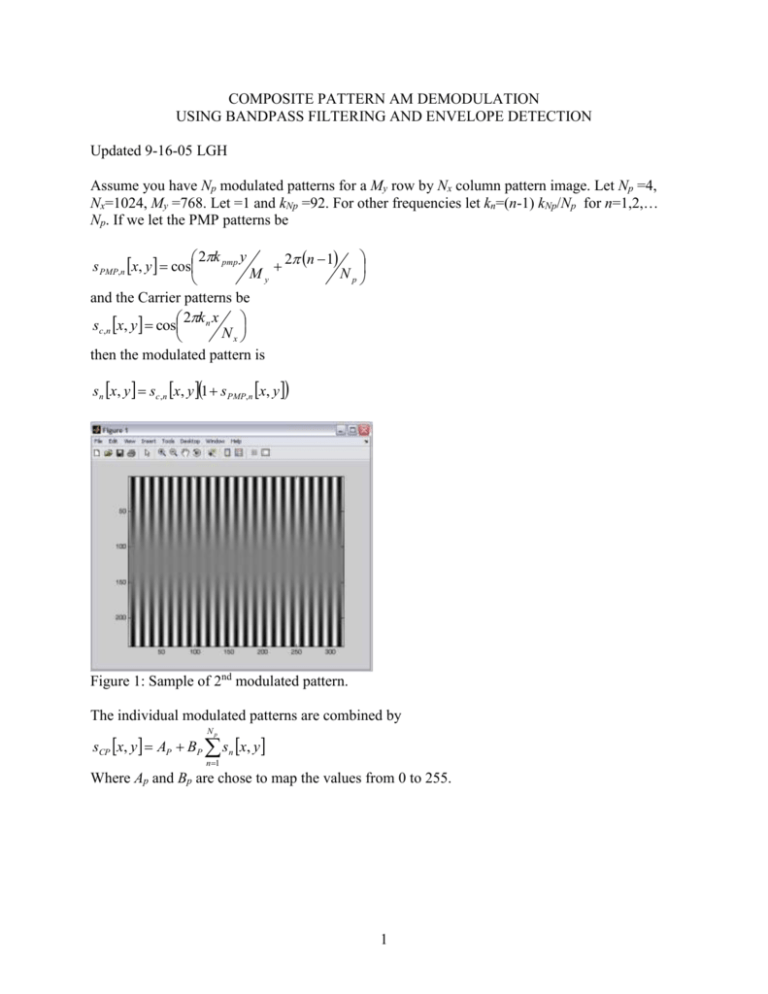
COMPOSITE PATTERN AM DEMODULATION USING BANDPASS FILTERING AND ENVELOPE DETECTION Updated 9-16-05 LGH Assume you have Np modulated patterns for a My row by Nx column pattern image. Let Np =4, Nx=1024, My =768. Let =1 and kNp =92. For other frequencies let kn=(n-1) kNp/Np for n=1,2,… Np. If we let the PMP patterns be 2k pmp y s PMP,n x, y cos 2 n 1 M N y p and the Carrier patterns be 2k n x sc,n x, y cos N x then the modulated pattern is sn x, y sc ,n x, y 1 s PMP,n x, y Figure 1: Sample of 2nd modulated pattern. The individual modulated patterns are combined by Np sCP x, y AP BP sn x, y n 1 Where Ap and Bp are chose to map the values from 0 to 255. 1 Figure 2: Sample Composite Pattern. ANALYSIS AND VISUALIZATION Perform a 2-D Discrete Fourier Transform (hint: use fft2 in MATLAB) on the composite pattern and point out the Np different channel signals in the DFT domain. Plot real, imaginary and magnitude spectra as an image. You can suppress the “dc” term by letting SCP[u,v]=0; S CP u , v M y 1 N x 1 j 2ux j 2vy s x, y exp N M y 0 x 0 CP x y Figure 3: 2-Dimensional FFT of CP. The dc is zeroed out and the origin is shifted to the center of the image. Perform a 1-D DFT (Hint: use fft and perform on each row) on each row and plot, real, imaginary and magnitude of resulting matrix. Indicate where the channels are based on the magnitude image. 2 SCP u, y j 2ux s x, yexp N N x 1 x 0 CP x Figure 4: Partial DFT of the CP. Note the cosine amplitude is preserved in the vertical space direction. DEMODULATION OF Nth CHANNEL Bandpass filter that channel. For simplicity use a rectangular filter given by u kn Nx H BP,n u rect Bx u kn Nx rect Bx 3 Figure 5: All four BandPass filters shown in 1-D format. where Bx/2 is half way between adjacent channels. Hint: negative frequencies wrap around so for k=0 is dc then if k<0, the computer index is knew=Nx-k. The intermediate result is GCP ,n u, y S CP u, y H BP,n u Inverse DFT (hint: use ifft) back to the space domain such that g CP ,n x, y 1 Nx j 2ux G u, yexp N N x 1 u 0 CP ,n x 4 Figure 7: Bandpass filtered channel. and square such that 2 f CP ,n x, y gCP ,n x, y Then DFT back to frequency domain and lowpass filter with a rectangular filter (hint: use irect) centered about the origin. The filter is given by u H LP u rect BLPx where BLPx is equal to twice the value of the first carrier frequency k1. The response is RCP ,n u, y FCP ,n u , y H LP u Square root the resulting envelope in the space domain to get the PMP estimate. ~ s PMP,n x, y rCP ,n x, y 5 Figure 8: Demodulated channel. DEMODULATION OF ALL CHANNELS Perform these steps for all Np channels and show results. PHASE RETRIEVAL With all Np demodulated images, the phase is retrieved by Np ~ s PMP,n x, y sin 2 (n 1) / N p x, y arctan Nnp1 ~ s PMP,n x, y cos2 (n 1) / N p n 1 Plot the phase image. 6 Figure 9: Left is phase. By using a negative sine on one of the atan2(y,-x), parameters, the phase is shifted properly. 7


