PROBLEMS
advertisement
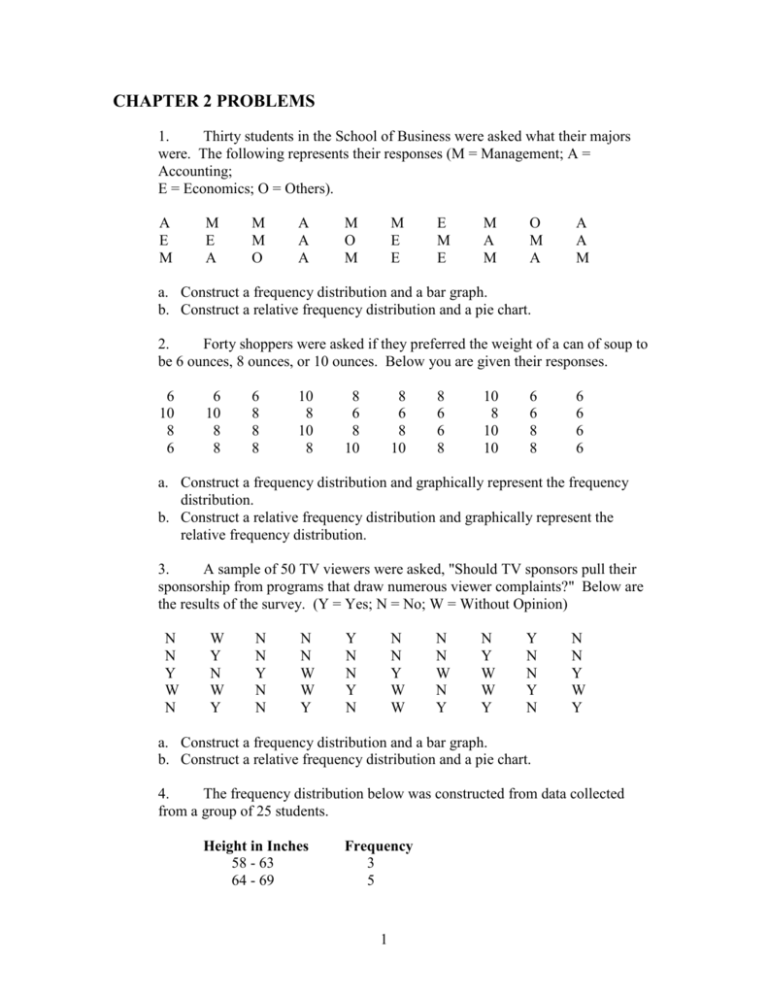
CHAPTER 2 PROBLEMS 1. Thirty students in the School of Business were asked what their majors were. The following represents their responses (M = Management; A = Accounting; E = Economics; O = Others). A E M M E A M M O A A A M O M M E E E M E M A M O M A A A M a. Construct a frequency distribution and a bar graph. b. Construct a relative frequency distribution and a pie chart. 2. Forty shoppers were asked if they preferred the weight of a can of soup to be 6 ounces, 8 ounces, or 10 ounces. Below you are given their responses. 6 10 8 6 6 10 8 8 6 8 8 8 10 8 10 8 8 6 8 10 8 6 8 10 8 6 6 8 10 8 10 10 6 6 8 8 6 6 6 6 a. Construct a frequency distribution and graphically represent the frequency distribution. b. Construct a relative frequency distribution and graphically represent the relative frequency distribution. 3. A sample of 50 TV viewers were asked, "Should TV sponsors pull their sponsorship from programs that draw numerous viewer complaints?" Below are the results of the survey. (Y = Yes; N = No; W = Without Opinion) N N Y W N W Y N W Y N N Y N N N N W W Y Y N N Y N N N Y W W N N W N Y N Y W W Y Y N N Y N N N Y W Y a. Construct a frequency distribution and a bar graph. b. Construct a relative frequency distribution and a pie chart. 4. The frequency distribution below was constructed from data collected from a group of 25 students. Height in Inches 58 - 63 64 - 69 Frequency 3 5 1 Descriptive Statistics: Tabular and Graphical Methods 70 - 75 76 - 81 82 - 87 88 - 93 94 - 99 2 2 6 4 3 2 a. Construct a relative frequency distribution. b. Construct a cumulative frequency distribution. c. Construct a cumulative relative frequency distribution. 5. The grades of 10 students on their first management test are shown below. 94 68 61 75 96 85 66 84 92 78 a. Construct a frequency distribution. Let the first class be 60 - 69. b. Construct a cumulative frequency distribution. c. Construct a relative frequency distribution. 6. You are given the following data on the ages of employees at a company. Construct a stem-and-leaf display. 26 52 41 42 7. 32 44 53 44 28 36 55 40 45 42 48 36 58 27 32 37 Construct a stem-and-leaf display for the following data. 12 49 52 43 51 45 37 19 47 36 40 32 38 44 26 48 57 22 31 18 8. For the following observations, plot a scatter diagram and indicate what kind of relationship (if any) exist between x and y. x 2 6 3 5 4 y 7 19 9 17 11
