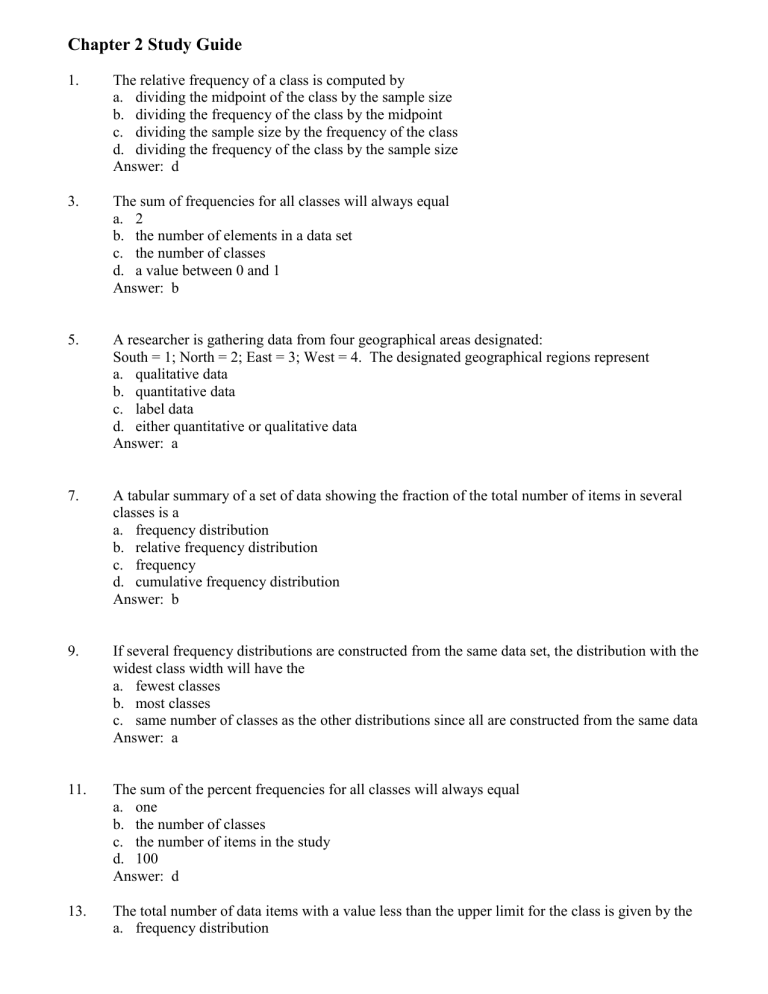
Chapter 2 Study Guide 1. The relative frequency of a class is computed by a. dividing the midpoint of the class by the sample size b. dividing the frequency of the class by the midpoint c. dividing the sample size by the frequency of the class d. dividing the frequency of the class by the sample size Answer: d 3. The sum of frequencies for all classes will always equal a. 2 b. the number of elements in a data set c. the number of classes d. a value between 0 and 1 Answer: b 5. A researcher is gathering data from four geographical areas designated: South = 1; North = 2; East = 3; West = 4. The designated geographical regions represent a. qualitative data b. quantitative data c. label data d. either quantitative or qualitative data Answer: a 7. A tabular summary of a set of data showing the fraction of the total number of items in several classes is a a. frequency distribution b. relative frequency distribution c. frequency d. cumulative frequency distribution Answer: b 9. If several frequency distributions are constructed from the same data set, the distribution with the widest class width will have the a. fewest classes b. most classes c. same number of classes as the other distributions since all are constructed from the same data Answer: a 11. The sum of the percent frequencies for all classes will always equal a. one b. the number of classes c. the number of items in the study d. 100 Answer: d 13. The total number of data items with a value less than the upper limit for the class is given by the a. frequency distribution b. relative frequency distribution c. cumulative frequency distribution d. cumulative relative frequency distribution Answer: c Exhibit 2-1 The numbers of hours worked (per week) by 400 statistics students are shown below. Number of hours 0- 9 10 - 19 20 - 29 30 - 39 Frequency 20 80 200 100 15. Refer to Exhibit 2-1. The number of students working 19 hours or less a. is 80 b. is 100 c. is 180 d. is 300 Answer: b 17. Refer to Exhibit 2-1. The percentage of students working 19 hours or less is a. 20% b. 25% c. 75% d. 80% Answer: b 19. Refer to Exhibit 2-1. The cumulative percent frequency for the class of 30 - 39 is a. 100% b. 75% c. 50% d. 25% Answer: a 21. Refer to Exhibit 2-1. If a cumulative frequency distribution is developed for the above data, the last class will have a cumulative frequency of a. 100 b. 1 c. 30 - 39 d. 400 Answer: d 23. Refer to Exhibit 2-1. The number of students who work 19 hours or less is a. 80 b. 100 c. 200 d. 400 Answer: b 25. In constructing a frequency distribution, as the number of classes are decreased, the class width a. decreases b. remains unchanged c. increases d. can increase or decrease depending on the data values Answer: c 27. In a cumulative frequency distribution, the last class will always have a cumulative frequency equal to a. one b. 100% c. the total number of elements in the data set Answer: c 29. In a cumulative percent frequency distribution, the last class will have a cumulative percent frequency equal to a. one b. 100 c. the total number of elements in the data set Answer: b 31. A tabular method that can be used to summarize the data on two variables simultaneously is called a. simultaneous equations b. crosstabulation c. a histogram d. an ogive Answer: b Exhibit 2-2 A survey of 800 college seniors resulted in the following crosstabulation regarding their undergraduate major and whether or not they plan to go to graduate school. Undergraduate Major Graduate School Business Engineering Others Total Yes 70 84 126 280 No 182 208 130 520 Total 252 292 256 800 33. Refer to Exhibit 2-2. What percentage of the students does not plan to go to graduate school? a. 280 b. 520 c. 65 d. 32 Answer: c 35. Refer to Exhibit 2-2. Of those students who are majoring in business, what percentage plans to go to graduate school? a. 27.78 b. 8.75 c. 70 d. 72.22 Answer: a PROBLEMS 1. Thirty students in the School of Business were asked what their majors were. The following represents their responses (M = Management; A = Accounting; E = Economics; O = Others). A E M M E A M M O A A A M O M M E E E M E M A M O M A A A M a. Construct a frequency distribution and a bar graph. b. Construct a relative frequency distribution and a pie chart. Answers: a. and b. Major M A E O Total Relative Frequency 12 9 6 3 30 Frequency 0.4 0.3 0.2 0.1 1.0 2. Forty shoppers were asked if they preferred the weight of a can of soup to be 6 ounces, 8 ounces, or 10 ounces. Below you are given their responses. 6 10 8 6 6 10 8 8 6 8 8 8 10 8 10 8 8 6 8 10 8 6 8 10 8 6 6 8 10 8 10 10 6 6 8 8 6 6 6 6 a. Construct a frequency distribution and graphically represent the frequency distribution. b. Construct a relative frequency distribution and graphically represent the relative frequency distribution. Answers: a. and b. Preferences 6 ounces 8 ounces 10 ounces Total 3. Relative Frequency 0.350 0.425 0.225 1.000 Frequency 14 17 9 40 A sample of 50 TV viewers were asked, "Should TV sponsors pull their sponsorship from programs that draw numerous viewer complaints?" Below are the results of the survey. (Y = Yes; N = No; W = Without Opinion) N N Y W W Y N W N N Y N N N W W Y N N Y N N Y W N N W N N Y W W Y N N Y N N Y W N Y N Y N W Y Y N Y a. Construct a frequency distribution and a bar graph. b. Construct a relative frequency distribution and a pie chart. Answers: a. and b. No Yes Without Opinion Total 4. Relative Frequency 0.48 0.30 0.22 1.00 Frequency 24 15 11 50 The frequency distribution below was constructed from data collected from a group of 25 students. Height in Inches 58 - 63 64 - 69 70 - 75 76 - 81 82 - 87 88 - 93 94 - 99 Frequency 3 5 2 6 4 3 2 a. Construct a relative frequency distribution. b. Construct a cumulative frequency distribution. c. Construct a cumulative relative frequency distribution. Answers: a. b. c. Cumulative Height Relative Cumulative Relative (In Inches) Frequency Frequency Frequency Frequency 58 - 63 3 0.12 3 0.12 64 - 69 5 0.20 8 0.32 70 - 75 2 0.08 10 0.40 76 - 81 6 0.24 16 0.64 82 - 87 4 0.16 20 0.80 88 - 93 3 0.12 23 0.92 94 - 99 2 0.08 25 1.00 1.00 5. The grades of 10 students on their first management test are shown below. 94 61 96 66 92 68 75 85 84 78 a. Construct a frequency distribution. Let the first class be 60 - 69. b. Construct a cumulative frequency distribution. c. Construct a relative frequency distribution. Answers: a. 6. Cumulative Relative Frequency Frequency Frequency 60 - 69 3 3 0.3 70 - 79 2 5 0.2 80 - 89 2 7 0.2 90 - 99 3 10 0.3 Total 10 1.0 You are given the following data on the ages of employees at a company. Construct a stem-and-leaf display. Answer: 2|6 7 3|2 2 4|0 1 5|2 3 8 6 2 5 6 4 8 7 4 5 32 44 53 44 28 36 55 40 45 42 48 36 58 27 32 37 8 Construct a stem-and-leaf display for the following data. 12 49 Answer: 1|2 2|2 3|1 4|0 5|1 8. c. Class 26 52 41 42 7. b. 8 6 2 3 2 52 43 51 45 37 19 47 36 40 32 38 44 26 48 57 22 31 18 9 6 4 7 7 5 8 7 8 9 For the following observations, plot a scatter diagram and indicate what kind of relationship (if any) exist between x and y. x y 2 6 3 5 4 7 19 9 17 11 Answer: A positive relationship between x and y appears to exist.

