Homework 3
advertisement
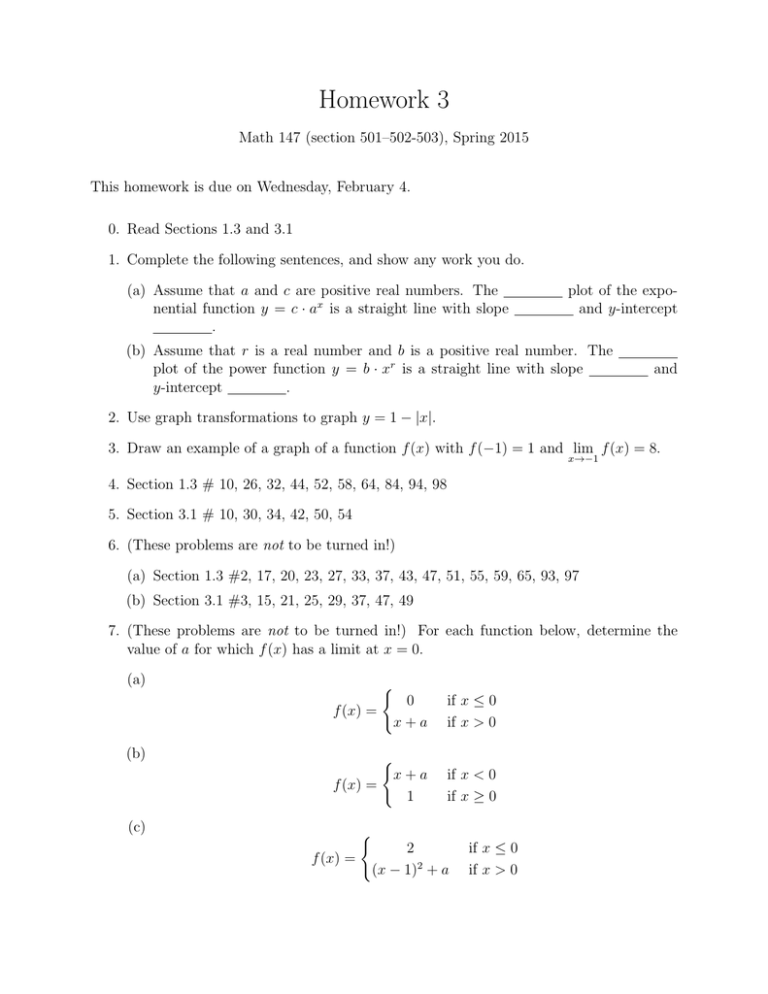
Homework 3 Math 147 (section 501–502-503), Spring 2015 This homework is due on Wednesday, February 4. 0. Read Sections 1.3 and 3.1 1. Complete the following sentences, and show any work you do. (a) Assume that a and c are positive real numbers. The nential function y = c · ax is a straight line with slope . plot of the expoand y-intercept (b) Assume that r is a real number and b is a positive real number. The plot of the power function y = b · xr is a straight line with slope y-intercept . and 2. Use graph transformations to graph y = 1 − |x|. 3. Draw an example of a graph of a function f (x) with f (−1) = 1 and lim f (x) = 8. x→−1 4. Section 1.3 # 10, 26, 32, 44, 52, 58, 64, 84, 94, 98 5. Section 3.1 # 10, 30, 34, 42, 50, 54 6. (These problems are not to be turned in!) (a) Section 1.3 #2, 17, 20, 23, 27, 33, 37, 43, 47, 51, 55, 59, 65, 93, 97 (b) Section 3.1 #3, 15, 21, 25, 29, 37, 47, 49 7. (These problems are not to be turned in!) For each function below, determine the value of a for which f (x) has a limit at x = 0. (a) ( 0 x+a if x ≤ 0 if x > 0 ( x+a f (x) = 1 if x < 0 if x ≥ 0 f (x) = (b) (c) ( f (x) = 2 (x − 1)2 + a if x ≤ 0 if x > 0
