Time in Amount of Seconds
advertisement
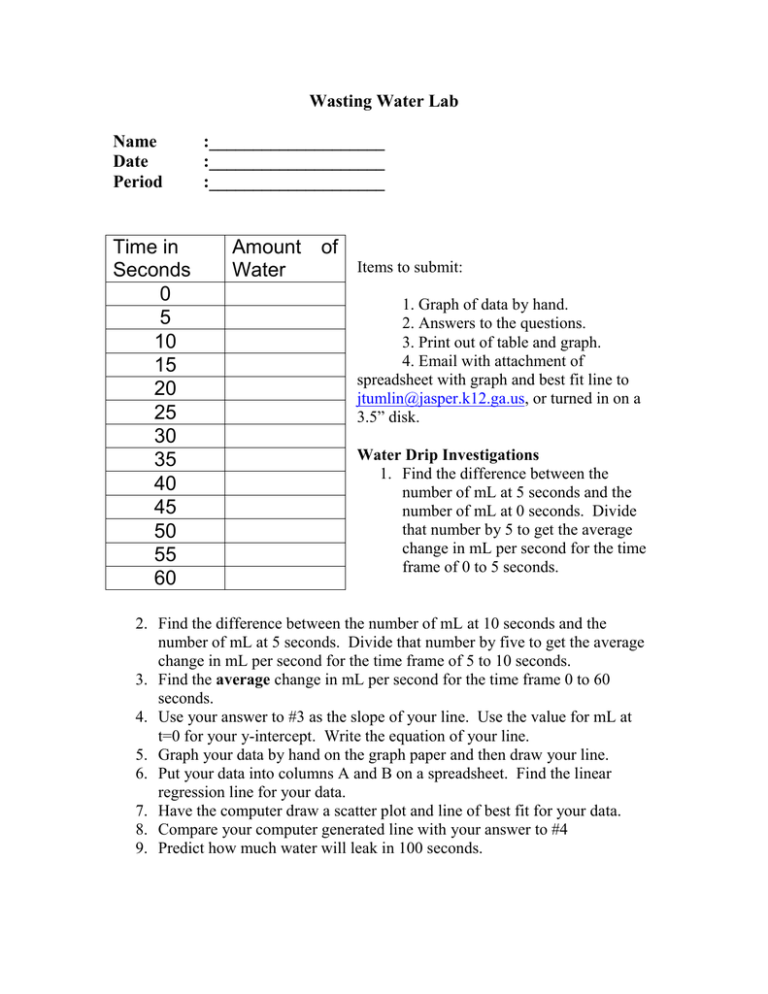
Wasting Water Lab Name Date Period Time in Seconds 0 5 10 15 20 25 30 35 40 45 50 55 60 :____________________ :____________________ :____________________ Amount Water of Items to submit: 1. Graph of data by hand. 2. Answers to the questions. 3. Print out of table and graph. 4. Email with attachment of spreadsheet with graph and best fit line to jtumlin@jasper.k12.ga.us, or turned in on a 3.5” disk. Water Drip Investigations 1. Find the difference between the number of mL at 5 seconds and the number of mL at 0 seconds. Divide that number by 5 to get the average change in mL per second for the time frame of 0 to 5 seconds. 2. Find the difference between the number of mL at 10 seconds and the number of mL at 5 seconds. Divide that number by five to get the average change in mL per second for the time frame of 5 to 10 seconds. 3. Find the average change in mL per second for the time frame 0 to 60 seconds. 4. Use your answer to #3 as the slope of your line. Use the value for mL at t=0 for your y-intercept. Write the equation of your line. 5. Graph your data by hand on the graph paper and then draw your line. 6. Put your data into columns A and B on a spreadsheet. Find the linear regression line for your data. 7. Have the computer draw a scatter plot and line of best fit for your data. 8. Compare your computer generated line with your answer to #4 9. Predict how much water will leak in 100 seconds. Name Date Period :____________________ :____________________ :____________________
