Acid & Base pH Lab
advertisement
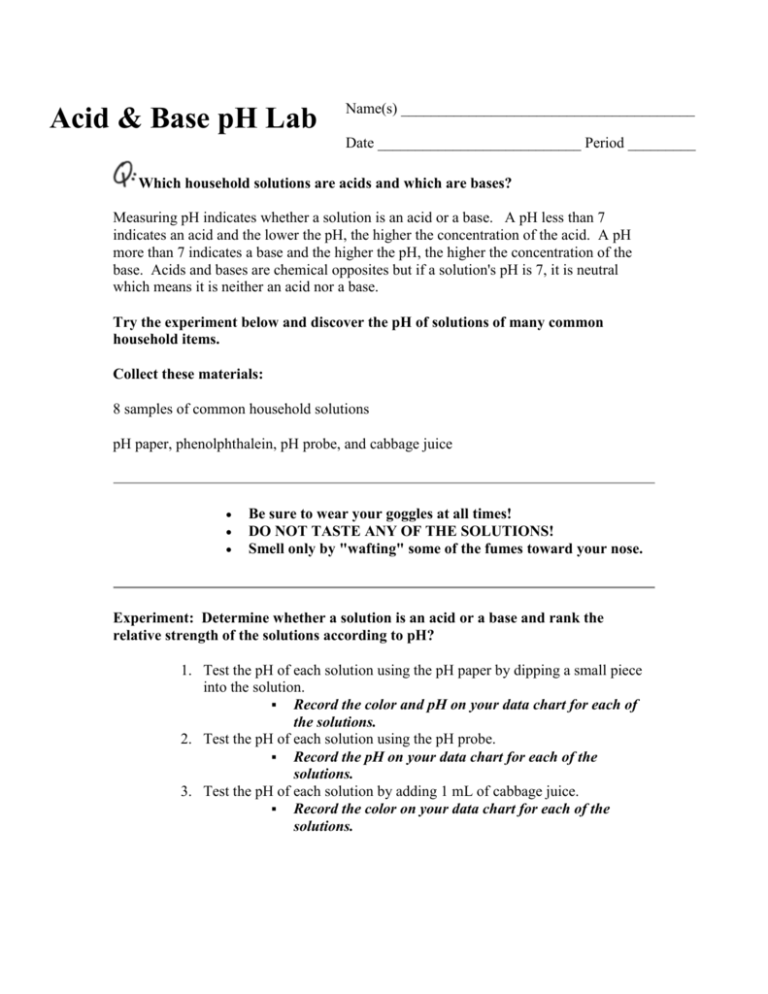
Acid & Base pH Lab Name(s) _______________________________________ Date ___________________________ Period _________ Which household solutions are acids and which are bases? Measuring pH indicates whether a solution is an acid or a base. A pH less than 7 indicates an acid and the lower the pH, the higher the concentration of the acid. A pH more than 7 indicates a base and the higher the pH, the higher the concentration of the base. Acids and bases are chemical opposites but if a solution's pH is 7, it is neutral which means it is neither an acid nor a base. Try the experiment below and discover the pH of solutions of many common household items. Collect these materials: 8 samples of common household solutions pH paper, phenolphthalein, pH probe, and cabbage juice Be sure to wear your goggles at all times! DO NOT TASTE ANY OF THE SOLUTIONS! Smell only by "wafting" some of the fumes toward your nose. Experiment: Determine whether a solution is an acid or a base and rank the relative strength of the solutions according to pH? 1. Test the pH of each solution using the pH paper by dipping a small piece into the solution. Record the color and pH on your data chart for each of the solutions. 2. Test the pH of each solution using the pH probe. Record the pH on your data chart for each of the solutions. 3. Test the pH of each solution by adding 1 mL of cabbage juice. Record the color on your data chart for each of the solutions. 4. Test the pH of each solution by adding 2 drops of phenolphthalein. Record the color on your data chart for each of the solutions. 5. Now determine if the solutions were acids (pH from 0 - 6), neutral (pH 7) or bases (pH from 8 - 14) Record this information on your data chart beside each solution. 6. Clean up your lab area completely. Data Table: Solution Name pH paper pH probe phenolpthalein Cabbage Juice Acid or Base? Summary Report: Choose and complete one of the following methods for displaying the properties of acids and bases and showing which solutions are acid, neutral, or base. A. Make a Venn diagram and fill in the names that were in each of the solutions in the correct section in the diagram and write the properties in the correct section. (See example below.) B. Draw a concept map or word web comparing and contrasting acids and bases and add descriptive words and examples. (See example at the bottom.) C. Create a continuum (similar to a time line) with the solution substances listed along it in order of their pH. Show the pH and label the continuum to show where acids, bases, and neutral occur along with descriptive phrases. D. Make up your own scheme for showing the results of your experiment. Sample Venn Diagram: Sample Concept Map:
