CONTRIBUTION TO THE SIMULATION OF THE OROGRAPHIC
advertisement

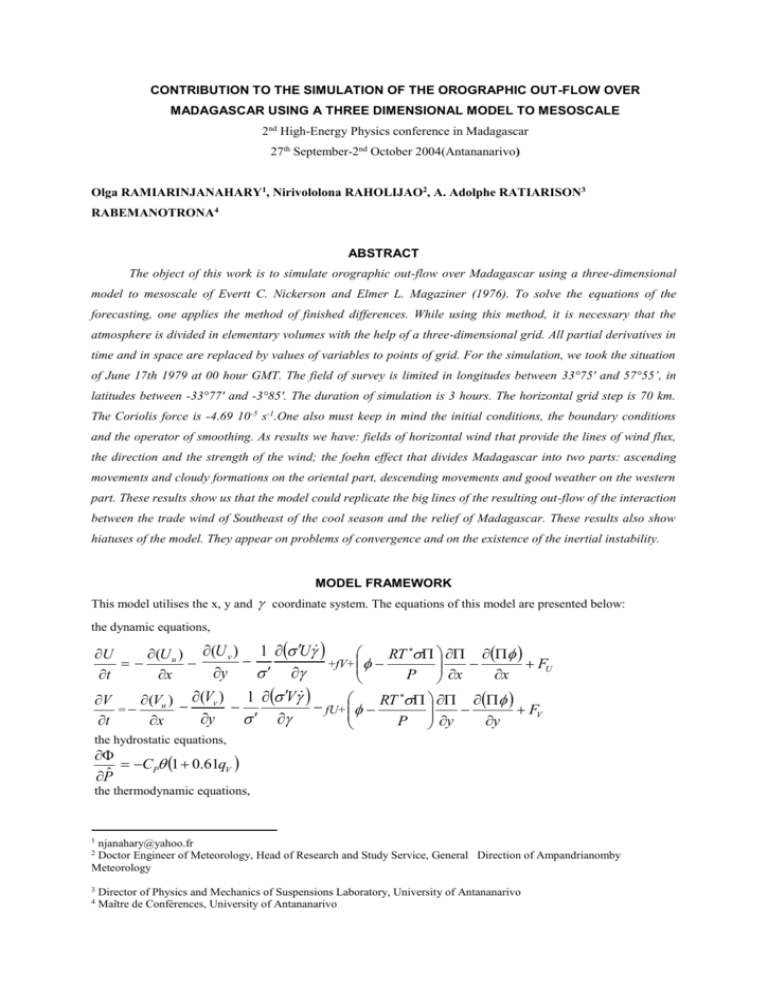
CONTRIBUTION TO THE SIMULATION OF THE OROGRAPHIC OUT-FLOW OVER MADAGASCAR USING A THREE DIMENSIONAL MODEL TO MESOSCALE 2nd High-Energy Physics conference in Madagascar 27th September-2nd October 2004(Antananarivo) Olga RAMIARINJANAHARY1, Nirivololona RAHOLIJAO2, A. Adolphe RATIARISON3 RABEMANOTRONA4 ABSTRACT The object of this work is to simulate orographic out-flow over Madagascar using a three-dimensional model to mesoscale of Evertt C. Nickerson and Elmer L. Magaziner (1976). To solve the equations of the forecasting, one applies the method of finished differences. While using this method, it is necessary that the atmosphere is divided in elementary volumes with the help of a three-dimensional grid. All partial derivatives in time and in space are replaced by values of variables to points of grid. For the simulation, we took the situation of June 17th 1979 at 00 hour GMT. The field of survey is limited in longitudes between 33°75' and 57°55’, in latitudes between -33°77' and -3°85'. The duration of simulation is 3 hours. The horizontal grid step is 70 km. The Coriolis force is -4.69 10-5 s-1.One also must keep in mind the initial conditions, the boundary conditions and the operator of smoothing. As results we have: fields of horizontal wind that provide the lines of wind flux, the direction and the strength of the wind; the foehn effect that divides Madagascar into two parts: ascending movements and cloudy formations on the oriental part, descending movements and good weather on the western part. These results show us that the model could replicate the big lines of the resulting out-flow of the interaction between the trade wind of Southeast of the cool season and the relief of Madagascar. These results also show hiatuses of the model. They appear on problems of convergence and on the existence of the inertial instability. MODEL FRAMEWORK This model utilises the x, y and coordinate system. The equations of this model are presented below: the dynamic equations, (U u ) (U v ) 1 U U RT +fV+ FU y x t P x x (Vu ) (Vv ) 1 V V RT = fU+ FV y x t P y y the hydrostatic equations, CP 1 0.61qV P̂ the thermodynamic equations, 1 njanahary@yahoo.fr Doctor Engineer of Meteorology, Head of Research and Study Service, General Direction of Ampandrianomby Meteorology 2 3 4 Director of Physics and Mechanics of Suspensions Laboratory, University of Antananarivo Maître de Conférences, University of Antananarivo S Su Sv 1 S FS t x y W Wu Wv 1 W FW t x y The symbols are defined as follows: CP : Coefficient of specific heat at constant pressure f : Coriolis parameter FU , FV , FW , FS : Frictional force relative in U, V, W, S intervening from the planetary boundary layer Lv : Latent heat of vapouring, 597.3 0.566T 273.16 P R CP P : Pressure, Po : Reference pressure [= 1013 mbar], P̂ : Normal Pressure, P0 PS : Pressure above the soil, PT : Pressure on the domain of survey, [= 100 mbar] qCW : Mixing ratio of water cloudy, qV : Mixing ratio of water vapour, qVS : Mixing ratio saturate R: Universal gas constant, [=287.04] T Lq S : Entropy, ln V , T : Temperature, T : Virtual temperature, T 1 0.61qV Pˆ C P P R P CP U : u , V : v , W : Humidity, qV qCW , : Potential temperature, T P0 1 U V d : Vertical coordinate, : Generalized vertical velocity, 0 t x y 4 4 P PT d PS PT , = ,= , : PS PT d 3 : Geopotential , t : Step of time integration, [= 15ses], x, y : Step of horizontal grid, [= 70kms] : Length of vertical grid, [=1/15] RESULTS The results of the simulation of the horizontal wind fields, the lines of flux, the vertical velocity and the cloudy fields are presented and are analyzed below. Map n° 1 shows us the contour of the relief of Madagascar. Map n° 2 presents us the initial fields that are horizontally homogeneous on this domain of survey. Map n°03 represents: project the lines of flux in 300 ms above the soil after 3 hours of simulation With the wind of the massif of Tsaratanana, the lines of flux took two directions: one moves towards the Northwest and gets round the pick; the other is deviated little by little southbound, touching the Bay of Antogil. Downwind, the current heads Southbound and moves in its initial direction which is toward the West. It crosses regions of the Northwest, and then gets out in the Northwest coast to take the initial direction mentioned above. With the wind of the High Central Plateaus, the lines of flux are spaced. The current divides itself into two directions: the one heads out Northwards; the other goes down towards the Southwest and gets round the massif of Ankaratra. The Lines of flux carry up the crest. Downwind of the High Central Plateaus, the flux divides into two directions: the first one goes back towards the Northwest of regions to the West centre, then moves towards the west and gets out in the West central coast to take the initial direction. The second one goes down towards the Southwest and moves towards the West, then gets out of the West central coast. With the wind of the massif of Andringitra, the current goes back towards the Northwest and gets round the pick. Downwind, the flux moves towards the west and gets out of the South-western coast. While touching the Anosyenne chain, the lines of flux join themselves. They cannot go beyond this chain. Map n° 4 is the representation of the horizontal wind field calculated in 300 ms above the soil after 2 hours of simulation. While approaching the mid-south of the coast, the winds move to the Northeast. The winds that arrive on the central coast keep their direction to the southeast and to the northeast coast. They take the component in the South-eastern sector. With the wind of the massif of Tsaratanana, the High Central Plateaus and the massif of Andringitra, the intensity of winds increases. The winds move to the Southeast. Downwind of the massif of Tsaratanana, the High Central Plateaus and the massif of Andringitra, the direction of wind is from Northeast downwind. While arriving on the West coast, the winds blow progressively towards the Southeast. One saw that downwind the regions of Madagascar, the winds are rather strong and the strongest winds are located downwind the massif of Tsaratanana. Maps 5 to 7 show us the fields of vertical velocity calculated in 18 ms above the soil after 3 hours of simulation. We noticed ascending movements on the oriental part and descending movements on the western part. At t = 1 hour, the ascending currents superior to 4 cm/ses are located in the wind of the massif of Tsaratanana, the High Central Plateaus and the massif of Andringitra, At t = 3 hours, the descending currents superior to 6 cm/ses are located downwind the massif of Tsaratanana and the High Central Plateaus, Maps 8 to 10 present the cloudy fields calculated in 300 ms above the soil after 1 to 3 hours of simulation. The cloudy field is described by the distribution of the mixing ratio of non-precipitating cloud. We clearly see that the fœhn effect divides Madagascar into two parts: cloudy formations on the oriental parts and clear sky on the western parts. At t = 1 hour, the maximal value of the mixing ratio (0.55 g/kgs) is situated to the wind of the massif of Tsaratanana. After 2 to 3 hours of simulation, the maximal values (superior to 0.5g/kgs) are observed in the wind of the massif of Tsaratanana, the High Central Plateaus and in the massif of Andringitra. At the final time (3 hours), the mixing ratio of non-precipitating (0.8 g/kgs) is located to the wind of the massif of Andringitra. Map n°1: Contour of Madagascar relief UV (m/s) Map n°2: Horizontal wind field calculated in 18 ms above the soil (t = 0 hour) UV (m/s) Map n°3: Lines of wind flux in 300 ms above the soil Map n°4: Horizontal wind field calculated in 300 ms above the soil after 3 hours of simulation after 2 hours de simulation Maps n°8 to n°10 show us the mixing ratio of no-precipitating Maps n°5 to n°7 show us the vertical velocity calculated in 18 ms above the soil after 1, 2, 3 hours of simulation W (cm/s) cloud calculated in 300 ms above the soil after 1, 2, 3 hours of simulation QCW (g/kgs) Map n°5 W (cm/s) Map n°8 Map n°6 Map n°9 QCW (g/kg) W (cm/s) Map n°7 Map n°10 CONCLUSIONS In spite of the simplicity of the initialization method used, these results demonstrate that the model could replicate the big lines of the resulting out-flow of the interaction in season between the trade wind of cool Southeast and the relief of Madagascar. So this model can be used as a tool for regional and local forecasting to the General Direction of the Meteorology. These results also show hiatuses of the model which must be filled: - the Precipitations must be appropriately parameterised because of the present parameterisation of convergence problems in the resolution of the Newton equation. It didn't allow the treatment of rains in our simulation; - the rotation of the wind direction noted during 3 hours of simulation translates the existence of an inertial instability that would be necessary suppressed by a better initialization of the layer limits and refines the initialization of the model. ACKNOWLEDGMENTS Our thanks go to Adolphe RATIARISON, Prof, and RABEMANOTRONA, Dr, for the instructions and advices that they gave during my training. We also thank Nirivololona RAHOLIJAO, Dr, for her advices in the general orientation as well as her material support for the accomplishment of this work. This research is a contribution of the cooperation between the Physics and Mechanics of Suspensions Laboratory and the General Direction of Meteorology. REFERENCES [1] BROWNING K.A., F.F. HILL and C.W. PARDOE, 1974: "Structure and Mechanism of precipitation and the effect of orography in wintertime warm sector". Quarterly Journal of the Royal Meteorology Society, 100, pp 309-330 [2] DONQUE Gerald, November 1971: "Geographic contribution for survey of the climate of Madagascar" [3] DUVERGE Pierre January 1949: "Principles of dynamic Meteorology and types of weather in Madagascar" [4] Fiedler F., and H. Panofsky, 1970: "Atmospheric scales and spectral gaps". Bulletin American Meteorology Society, 51, pp 1114-1119 [5] Lavoie R. L. et al., 1967: "The warm rain project in Hawaii". Tellus, 19, pp 347-461 [6] M. MEZIN, 1950-1951: "Course of Meteorology and climatology" [7] M. Segal, Y. Mahre, R. A. Pielke, 1982: "Application of a numerical Mesoscale Model for the evaluation of seasonal persistent regional climatological patterns". Journal of Applied Meteorology, 21, pp 1754-1762 [8] Nickerson E. C. and V. E. Smiley, 1975: "Surface layer and energy budget parameterizations for mesoscale models" Journal of Applied Meteorology, 14, pp 297-300 [9] Nickerson E. C. and Elemer L. Magaziner, 1976: "A three dimensional simulation of winds and noprecipiting orographic cloud over Hawaii". U. S. Department of commerce NOAA Technical Report ERL 377, APCL 39 [10] ORVILLE H. D. and F. J. KOPP, 1977: "Numerical Simulation of the life history of a hailstorm". Journal of Atmospheric Science, 34, pp 1596-1918 [11] QUENEY P., 1936:"Relative research in relief influence on the meteorological elements ". The Meteorology, pp 334-470


