Effect of Pectinase Enzyme on Gala Juice Production Introduction As
advertisement
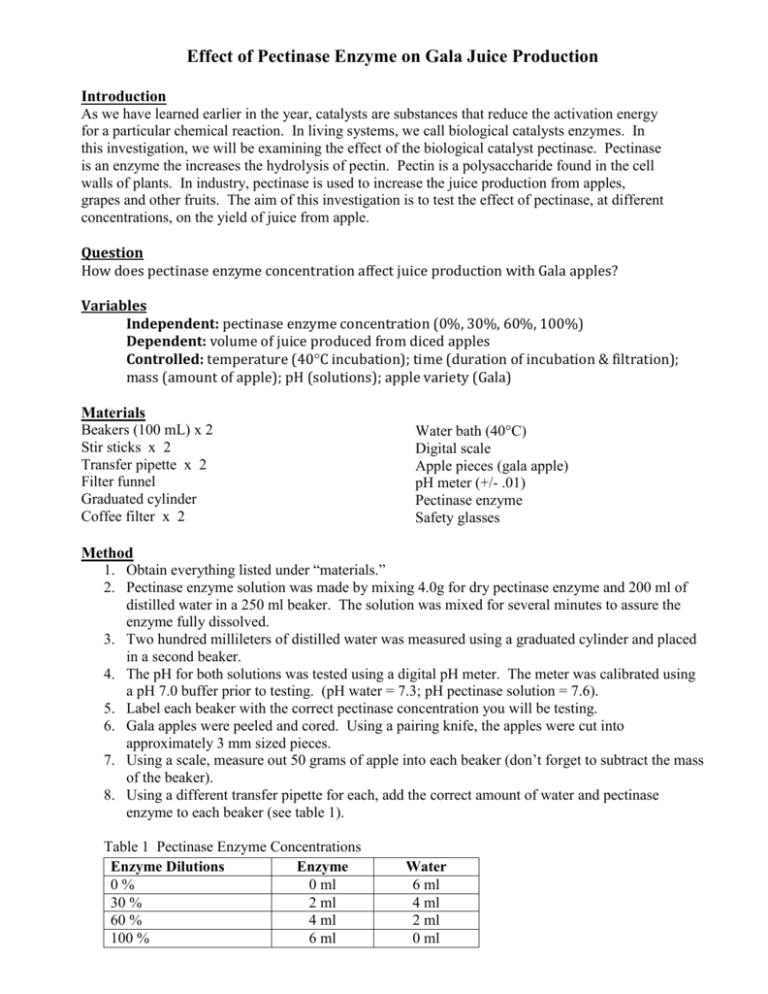
Effect of Pectinase Enzyme on Gala Juice Production Introduction As we have learned earlier in the year, catalysts are substances that reduce the activation energy for a particular chemical reaction. In living systems, we call biological catalysts enzymes. In this investigation, we will be examining the effect of the biological catalyst pectinase. Pectinase is an enzyme the increases the hydrolysis of pectin. Pectin is a polysaccharide found in the cell walls of plants. In industry, pectinase is used to increase the juice production from apples, grapes and other fruits. The aim of this investigation is to test the effect of pectinase, at different concentrations, on the yield of juice from apple. Question How does pectinase enzyme concentration affect juice production with Gala apples? Variables Independent: pectinase enzyme concentration (0%, 30%, 60%, 100%) Dependent: volume of juice produced from diced apples Controlled: temperature (40C incubation); time (duration of incubation & filtration); mass (amount of apple); pH (solutions); apple variety (Gala) Materials Beakers (100 mL) x 2 Stir sticks x 2 Transfer pipette x 2 Filter funnel Graduated cylinder Coffee filter x 2 Water bath (40C) Digital scale Apple pieces (gala apple) pH meter (+/- .01) Pectinase enzyme Safety glasses Method 1. Obtain everything listed under “materials.” 2. Pectinase enzyme solution was made by mixing 4.0g for dry pectinase enzyme and 200 ml of distilled water in a 250 ml beaker. The solution was mixed for several minutes to assure the enzyme fully dissolved. 3. Two hundred millileters of distilled water was measured using a graduated cylinder and placed in a second beaker. 4. The pH for both solutions was tested using a digital pH meter. The meter was calibrated using a pH 7.0 buffer prior to testing. (pH water = 7.3; pH pectinase solution = 7.6). 5. Label each beaker with the correct pectinase concentration you will be testing. 6. Gala apples were peeled and cored. Using a pairing knife, the apples were cut into approximately 3 mm sized pieces. 7. Using a scale, measure out 50 grams of apple into each beaker (don’t forget to subtract the mass of the beaker). 8. Using a different transfer pipette for each, add the correct amount of water and pectinase enzyme to each beaker (see table 1). Table 1 Pectinase Enzyme Concentrations Enzyme Dilutions Enzyme 0% 0 ml 30 % 2 ml 60 % 4 ml 100 % 6 ml Water 6 ml 4 ml 2 ml 0 ml 9. After adding the correct amount of enzyme and water to the beaker, use a different stir stick to stir the apples for about 10 seconds. 10. Using a thermometer a hot water bath was set to 40C. The apple solutions were incubated for 30 minutes. 11. While the apple solutions are incubating, set up the filter funnels with the graduated cylinders (see diagram on board). Make sure to label each cylinder with the correct enzyme concentration. 12. After 30 minutes, pour the contents of each beaker into the correct filter set up. 13. Allow the apple solution to drain into the cylinder for 30 minutes. 14. Measure the final volume of liquid collected in the graduated cylinder. 15. Record your data on the class data table. Results Table 2 Volume of liquid (mL) produced at four different pectinase concentrations (+/- 1 mL) Concentration (%) Replicate 0 30 60 100 1 1 18 40 6 2 28 30 20 38 3 [39] 5 2 11 4 15 1 16 41 Processed Data Overview: Short paragraph that provides an overview of how and why you decided to process and present the data in the form that shows up later in this section. Sample Calculations: xi Mean: x = N mean juice volume at 0% pectinase x = (1 + 28 + 15) / 3 = 14.5 mL Standard deviation: s = (x x) i 2 N 1 standard deviation for juice production at 0% pectinase s= 114.5 28 14.5 2 2 3 1 (15 14.5) 2 = 13.8 Table 3 Mean volume (mL) and standard deviation of juice production at four different pectinase concentrations Concentration (%) Replicate 0 30 60 100 Mean 14.5 13.3 19.5 24.1 S.D. 13.8 13.3 15.7 18.2 Figure 1. Mean volume (mL) of juice production at four different pectinase concentrations Mean volume (mL) (error bars represent +/- 1 standard deviation) Pectinase concentration (%) Conclusion Narrative section used to interpret the data o State a conclusion as it relates to your central question. o Discuss your conclusion including justifications based on reasonable interpretation of data. o Relate discussion to graph(s) to support your conclusion. Evaluation Narrative section used to evaluate your experimental design o Discuss limitations of experimental design: How well did your design help answer your central question? o What are some reasonable improvements that could be made?
