Hardy-Weinberg Assignment
advertisement
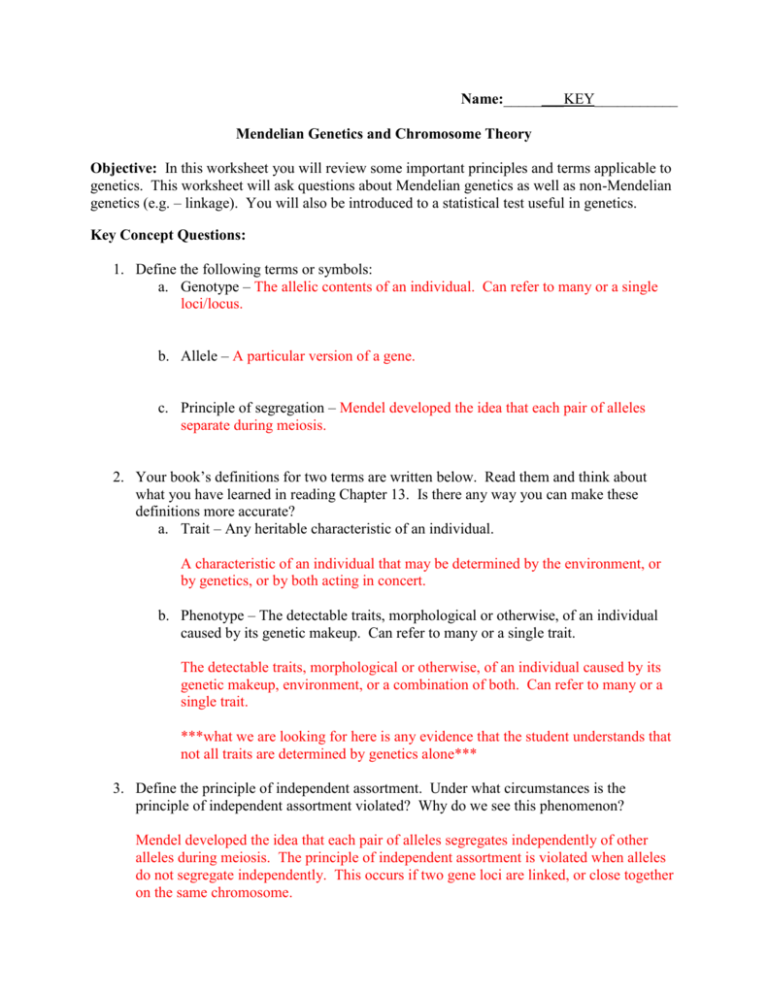
Name:________KEY___________ Mendelian Genetics and Chromosome Theory Objective: In this worksheet you will review some important principles and terms applicable to genetics. This worksheet will ask questions about Mendelian genetics as well as non-Mendelian genetics (e.g. – linkage). You will also be introduced to a statistical test useful in genetics. Key Concept Questions: 1. Define the following terms or symbols: a. Genotype – The allelic contents of an individual. Can refer to many or a single loci/locus. b. Allele – A particular version of a gene. c. Principle of segregation – Mendel developed the idea that each pair of alleles separate during meiosis. 2. Your book’s definitions for two terms are written below. Read them and think about what you have learned in reading Chapter 13. Is there any way you can make these definitions more accurate? a. Trait – Any heritable characteristic of an individual. A characteristic of an individual that may be determined by the environment, or by genetics, or by both acting in concert. b. Phenotype – The detectable traits, morphological or otherwise, of an individual caused by its genetic makeup. Can refer to many or a single trait. The detectable traits, morphological or otherwise, of an individual caused by its genetic makeup, environment, or a combination of both. Can refer to many or a single trait. ***what we are looking for here is any evidence that the student understands that not all traits are determined by genetics alone*** 3. Define the principle of independent assortment. Under what circumstances is the principle of independent assortment violated? Why do we see this phenomenon? Mendel developed the idea that each pair of alleles segregates independently of other alleles during meiosis. The principle of independent assortment is violated when alleles do not segregate independently. This occurs if two gene loci are linked, or close together on the same chromosome. Application Questions 4. Predict the results of the following cross where ‘y’ is the allele for red color and ‘Y’ is the allele for yellow color in a flower. ♀Yy x ♂Yy Y y Y YY Yy Y Yy yy a. Report the expected genotypic and phenotypic frequencies in fraction form (1/4 would mean that 1 offspring out of four offspring would have the phenotype or genotype). Genotypes – YY – ¼ Yy – ½ Yy – ¼ Phenotypes - red – ¾ yellow – ¼ b. Genotypic and phenotypic frequencies are different. What genetic principle can help explain why these frequencies are different? The genotypic and phenotypic frequencies are different because the Y allele is dominant to the y allele. Otherwise, the genotype Yy might have a different phenotype and the frequencies would be the same. 5. Suppose that after performing the above cross, you counted offspring and their phenotypes: Phenotype 1 – 82 Phenotype 2 – 18 a. Which phenotype is phenotype 1 and which is phenotype 2 according to your expectations from question 3? Phenotype 1 = red Phenotype 2 = yellow b. Did you know you can test whether or not your observed results are different from your expected results? This can be accomplished by using a Chi-Square test. Follow the steps below to compare the expected results and the observed results. i. First, we need to calculate the chi-square test statistic: Χ2 = Σ ((observed value – expected value)2/expected value) The Σ (the sum symbol) implies that you must compare the observed and expected values for all expected phenotypes and then sum them together. In our case with only two phenotypes, inserting our values into the above formula, the calculation would look like this without the Σ symbol. Χ2 = ((observed # of individuals with phenotype 1 – expected # of individuals with phenotype 1)2/expected # of individuals with phenotype 1) + ((observed # phenotype 2 – expected # phenotype 2)2/expected # phenotype 2) In order to find our expected # for each phenotype, we must multiply our expected frequency (from question 3a) by the total number of offspring of each phenotype from our cross (from question 4). Write the formula for the chi-square test statistic below with all the values filled in: Χ2 = ((82 – 75)2/75) + ((18 – 25)2/25) What value of chi-square did you get? ___2.61____ ii. Next, we have to compare our test statistic (chi-square value) to a table of critical values of the Chi-Square test. These tables can be found online or in a statistics textbook. Compare your results with the simplified table below. P-value Test Statistic 0.2 1.64 0.1 2.71 0.05 0.01 3.84 6.63 P-values assign a probability to the hypothesis that the observed and expected are not different. If our test statistic is greater than or equal to the test statistic under a P-value, then we assign that P-value to our test. Example: I calculate a test statistic of 4.34. I look at my table and see that it is greater than 3.84, but less than 6.63. Thus, my P-value is less than 0.05 but greater than 0.01. I report my P-value as P<0.05 and I now know the hypothesis that the observed and expected values are not different, has a less than 5% (0.05 = 5%) chance of being true. In other words, there is less than a 5% chance that we would have calculated a chi-square value of that magnitude if there weren’t real differences between the observed and expected phenotypic values. The 5% level is an arbitrary cutoff that statisticians have agreed to accept as a probability indicating significance of a test statistic. I can say that my results indicate significant differences between observed and expected values. What P-value do you get when looking at the table? What does this Pvalue indicate (are the observed and expected differences significantly different)? P<0.2. The observed differences are not significantly different because the p-value is above 0.05. 6. Predict the outcome of the following dihybrid cross: ♀AaBb x ♂AaBb AB Ab aB ab AB AABB AABb AaBB AaBb Ab AABb AAbb AaBb Aabb aB AaBB AaBb aaBB aaBb ab AaBb Aabb aaBb aabb a. What are the expected phenotypic frequencies: Phenotype 1 – 9/16 Phenotype 2 – 3/16 Phenotype 3 – 3/16 Phenotype 4 – 1/16 b. Are they significantly different than observed frequencies after completing the cross? Use the space below and on the next page to provide your answer. Be sure to show your chi-square formula and test statistic value: Phenotype 1 – 3592 Phenotype 2 – 3421 Phenotype 3 – 390 Phenotype 4 - 254 P-value Test Statistic 0.2 4.64 0.1 6.25 0.05 7.81 0.01 11.34 Χ2 = ((3592 – 3550.5)2/3550.5) + ((3421 – 1183.5)2/1183.5) + ((390 – 1183.5)2/1183.5) + ((254 – 394.5)2/394.5) Χ2 = 4812.71 c. What could have caused such a result? Genetic linkage between the two traits could have caused the result. 7. A female fly is heterozygous for two X-linked traits (hairy wing (h) and orange body (o)), and is mated with a male fly that is mutant for both of these X-linked traits. a. Which alleles are linked if we get the following male offspring from an actual cross? ho/Y h+o+/Y h+o/Y ho+/Y 1285 1103 47 64 h+ – o and h – o+ are linked. b. What are the genotypes of the parents? ♂ho/Y ♀h+o/ ho+ c. How many cM separate the ‘h’ and ‘o’ loci on the X-chromosome given the results reported in 6a? 4.44cM d. If two loci were separated by 7.6 cM would they more or less likely to cross over and recombine? They would be more likely to recombine as they are further apart on the chromosome. 8. You are a genetic counselor and two couples are wondering about the likelihood of passing on a disorder to their children. Given their family history, and some genetic sampling, you are able to assemble the pedigree seen below. a. Looking at the pedigree, can you tell how this disease is inherited (autosomal/sexlinked; dominant/recessive) (circles = females, squares = males, full shading = affected person, half shading = person carrying disorder allele, dashed line shapes = children with unknown genotype)? What about the pedigree indicates your answer is correct? The disease is sex-linked recessive. I know this because only males are affected by the disease. Also, if it were autosomal recessive, all F1 offspring would be a carrier for the disease and one is not. b. Label the children (dashed line shapes) with the correct genotype. If there is more than one possible answer, choose one and give the probability of your answer occurring. Write your answer on the pedigree but feel free to show your work in the space below. Left couple – daughter sonRight couple - daughter son - affected – ½ carrier – ½ affected – ½ normal – ½ carrier – ½ normal – ½ affected – ½ normal – ½ 9. A woman has recently been diagnosed with breast cancer and requests that she be screened for the BRCA1 gene mutation. Individuals with mutations in this gene develop breast cancer 85% of the time. a. You discover that the woman does have the BRCA1 mutation. What is the chance that she will pass it on to her daughters? 50%. She has two alleles for the gene. b. What is the chance that the daughters might develop breast cancer if they inherit the BRCA1 mutation (hint: there is no calculation necessary for this question)? 85% c. What is the chance that one of the daughters inherits the BRCA1 mutation and develops breast cancer? 0.5 x 0.85 = 0.425
