Mendelian genetics module
advertisement
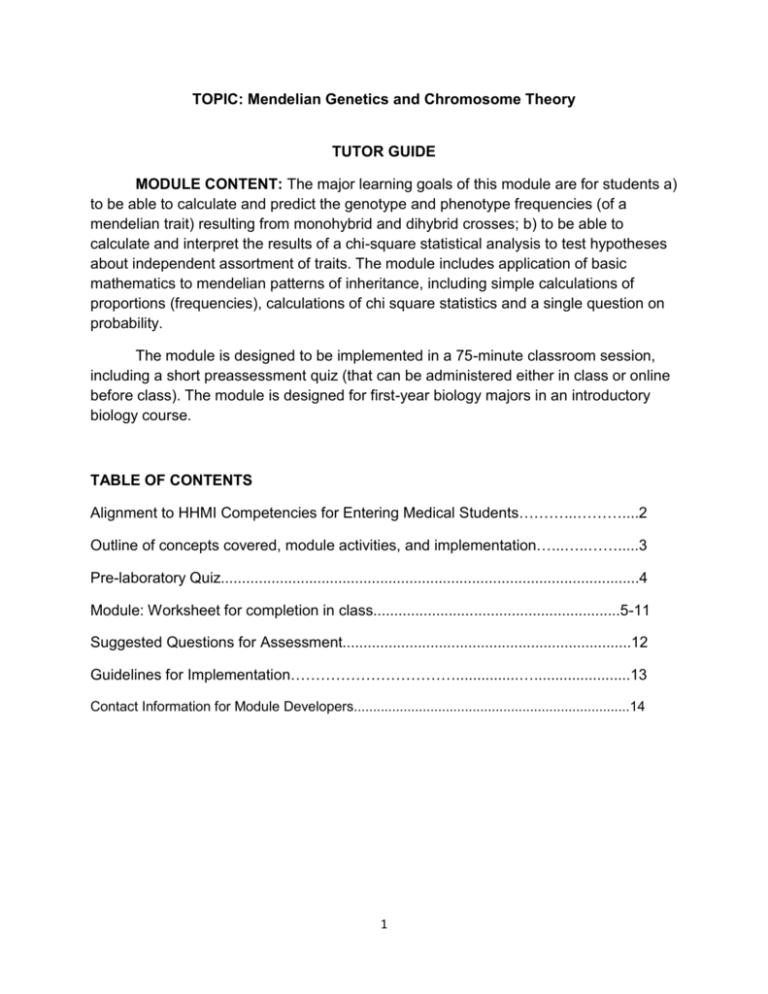
TOPIC: Mendelian Genetics and Chromosome Theory TUTOR GUIDE MODULE CONTENT: The major learning goals of this module are for students a) to be able to calculate and predict the genotype and phenotype frequencies (of a mendelian trait) resulting from monohybrid and dihybrid crosses; b) to be able to calculate and interpret the results of a chi-square statistical analysis to test hypotheses about independent assortment of traits. The module includes application of basic mathematics to mendelian patterns of inheritance, including simple calculations of proportions (frequencies), calculations of chi square statistics and a single question on probability. The module is designed to be implemented in a 75-minute classroom session, including a short preassessment quiz (that can be administered either in class or online before class). The module is designed for first-year biology majors in an introductory biology course. TABLE OF CONTENTS Alignment to HHMI Competencies for Entering Medical Students………...………....2 Outline of concepts covered, module activities, and implementation…...…..…….....3 Pre-laboratory Quiz....................................................................................................4 Module: Worksheet for completion in class...........................................................5-11 Suggested Questions for Assessment.....................................................................12 Guidelines for Implementation……………………………...............….......................13 Contact Information for Module Developers........................................................................14 1 Alignment to HHMI Competencies for Entering Medical Students: Competency Learning Objective Activity E1. Apply quantitative reasoning and appropriate mathematics to describe or explain phenomena in the natural world. E1.1. Demonstrate quantitative numeracy and facility with the language of mathematics. 3a; 4a-c; 5a-c; 6b;7a,c E1.3. Make statistical inferences from data sets 4b,c; 5a,b 2 Mathematical/Statistical Concepts covered: - basic arithmetic - probability - chi-square test Components of module: - Pre lab quiz - in class activities (preferably no worksheet - see guidelines for implementation): - suggested assessment questions - guidelines for implementation Estimated time to complete in class worksheet - 60 - 75 minutes Targeted students: - first year-biology majors in introductory biology course Quantitative Skills Required: - Basic arithmetic - Logical reasoning Module activities, and implementation - Students need only to have basic mathematical skills to complete this module. - Questions to use for assessment of the concepts and skills in this module. 3 Pre Lab QUIZ Name: _________________________________ Mendelian Genetics and Chromosome Theory 1. What is the difference between a monohybrid and a dihybrid cross? 2. What is the name of the statistical test we will be using in this module? 3. Name one of Mendel’s laws (principles) mentioned in this module? 4. In this module, a p-value of 0.5 is considered significant True False 5. The BRAC1 gene is linked to what type of cancer? a. Prostate b. Breast c. Skin d. Pancreatic 4 NAME: ____________________________________ Mendelian Genetics and Chromosome Theory Objective: In this worksheet you will review some important principles and terms applicable to genetics. This worksheet will ask questions about both Mendelian and non-Mendelian patterns of inheritance (e.g. those that might result from linkage). You will also utilize the chi-square statistical test to detect deviations from observed and expected in data from genetic crosses and be asked to interpret the results of this test. 1. Predict the results of the following cross where ‘y’ is the allele for red color and ‘Y’ is the allele for yellow color in a flower. Y is dominant to y. ♀ Yy x ♂ Yy a. Report the expected genotypic and phenotypic frequencies, in proportions – that is to say that if you find that a quarter of the offspring are expected to have the genotype YY, then you should report that 0.25 of the offspring will have the genotype YY. b. Genotypic and phenotypic frequencies are different. Why? 2. Suppose that after performing the above cross, you counted offspring and their phenotypes were as follows (these are your observed values): Phenotype 1 – 136 Phenotype 2 – 37 a. Which phenotype is phenotype 1 and which is phenotype 2 according to your expectations from question 1? 5 b. As we discussed in lecture, we can use chi-square (χ2) test statistics to determine whether expected outcomes were different than observed outcomes. We can use this test when looking at dihybrid crosses to determine if two genes are sorting independently. To do this, you will need to fill out the chi-square table below to see if the expected and observed patterns of red and yellow flowers are significantly different. You must use counts (not raw proportions) in the “O” and “E” columns. Calculate the expected values using the predicted phenotype frequencies (proportions that you calculated in Q 3a) and the total observed number of plants (from Q 4.) Observed (O) (O-E)2/E Expected (E) Yellow Red Χ2= 6 b. Next, we have to compare our test statistic (chi-square value) to a table of critical values of the chi-square test. Full versions of these tables can be found online or in a statistics textbook. Compare your results with the simplified table below. For this test, you have one degree of freedom because you have two categories (degrees of freedom = number of categories – 1) so focus on that row. Degrees of Freedom 1 2 3 4 .99 .80 .50 .20 .10 .05 .01 .001 p-values .00016 .20 .12 .30 .064 .45 1.0 1.6 .46 1.4 2.4 3.4 1.6 3.2 4.6 6.0 2.7 4.6 6.3 7.8 3.8 6.0 7.8 9.5 6.6 9.2 11.3 13.3 10.8 13.8 16.3 18.5 Test statistics Compare your test statistic to the ones in the table. What p-value is associated with this test statistic? For statistical tests, results are considered significant if the p-value is less than 0.05, so what does your pvalue indicate about your data? 3. Using the following phenotypes below (found in fruit flies), predict the possible genotypes of the following dihybrid cross: A = Black body; a = grey body B = Straight wings; b = curly wings ♀ AaBb x ♂ AaBb a. What are the expected phenotypic frequencies, assuming capital letters are dominant? Write these frequencies as counts in the table below, 7 using the information in 6b (below) to figure out the total number of F1 individuals. Observed (O) (O-E)2/E Expected (E) Χ2= b. After completing the cross, the number of offspring of each phenotype were counted (these are the F1 individuals), and these numbers are listed below. Enter them in the chi-square table above. Complete the chisquared table, including the test statistic (Χ2) value and its associated pvalue. Black, Straight – 850 grey, Straight – 28 grey, curly – 290 Black, curly – 32 Are the expected frequencies significantly different from the observed frequencies? (Here, you have four categories and you will need to calculate the degrees of freedom – refer to Q4c to determine how to do this.) c. What could have caused such a result? a. Predict all of the possible genotypes of the following dihybrid cross: ♀ AABB x ♂ AaBb 8 b. What are the expected phenotypic frequencies, assuming capital letters are dominant: 4. A woman has recently been diagnosed with breast cancer and requests that she be screened for the BRCA1 gene mutation. Individuals with mutations in this gene develop breast cancer 85% of the time. a. You discover that the woman does have one copy of the BRCA1 mutation. What is the chance that she will pass it on to her daughters? b. What is the chance that the daughters might develop breast cancer if they inherit the BRCA1 mutation (hint: there is no calculation necessary for this question)? c. What is the chance that one of the daughters inherits the BRCA1 mutation and develops breast cancer? 9 MODULE FEEDBACK - Each year we work to improve the modules in the active learning "discussion" sections. Please answer the following question with regard to this module on this sheet and turn in your answer to the TA. You can do this anonymously if you like by turning in this sheet separately from your module answers. How helpful was this module in helping you understand fundamental concepts in mendelian genetics? A = Extremely helpful B= Very helpful C= Moderately helpful D= A little bit helpful E = Not helpful at all Module Rating ____________ Thank you! 10 Suggested Questions for Assessment Learning Objective Activity E1.1. Demonstrate quantitative numeracy and facility with the language of mathematics. 4a-c; 5a-c E1.3. Make statistical inferences from data sets 4a-c;5a-c Questions 4 and 5 address every computational aspect of this module except for the probability question that appears in question 7. They also require written interpretation of the results of the statistical analyses. 11 Suggested Implementation: We expect that students will not have had a statistics course, although they will use statistical tests in this module. To deal with this, we suggest either that the chi-square test is reviewed in the lecture portion of the course in which this module will be used, or that the students receive a 10-15 minute explanation about how and why this statistical test is used in the context of the material, and go over the calculations. If this is done, we suggest giving the pre-module quiz to students to complete before coming to class. In class: Have students break up into groups, ideally of 3-4 students each. Students work as groups to solve the problems and completed modules turned in at the end of class. Alternatively, the module can be broken up so that the questions are projected one at a time and students given a set amount of time to complete each one. In this iteration of the module, groups could share their results on whiteboards as they are obtained. Give the students a few minutes with each question or sub-question—not a long time, no more than 3-4 minutes per question-- and some questions need only a minute, such as the first two questions. The shorter the interval, the higher the level of energy and interest in the room. As the students work, circulate and assist them (without giving them the answer, of course). At the end of the time period for the question, announce that there are 10 seconds remaining, then ring a bell or use some other pre-agreed signal, and at the signal, all student groups hold up their white boards with their answers. Use the boards as a basis for discussion if answers differ. If most student groups have the right answer, move on quickly to the next question. Alternatively, the questions can all be given together to each student group as a worksheet. This sounds like less work and stress for the TAs/instructors, but the one-ata-time-method keeps everyone on track, energized and having fun. Attitude Assessment Question: Make sure students turn in their attitude assessment question at the end of the module (these can either be turned in as separate sheets to maintain anonymity or as part of the module if you wish to give them participation credit for filling them out). 12 Module Developers: Please contact us if you have comments/suggestions/corrections Kathleen Hoffman Department of Mathematics and Statistics University of Maryland Baltimore County khoffman@math.umbc.edu Jeff Leips Department of Biological Sciences University of Maryland Baltimore County leips@umbc.edu Sarah Leupen Department of Biological Sciences University of Maryland Baltimore County leupen@umbc.edu Acknowledgments: This module was developed as part of the National Experiment in Undergraduate Science Education (NEXUS) through Grant No. 52007126 to the University of Maryland, Baltimore County (UMBC) from the Howard Hughes Medical Institute. 13


