pedigrees
advertisement
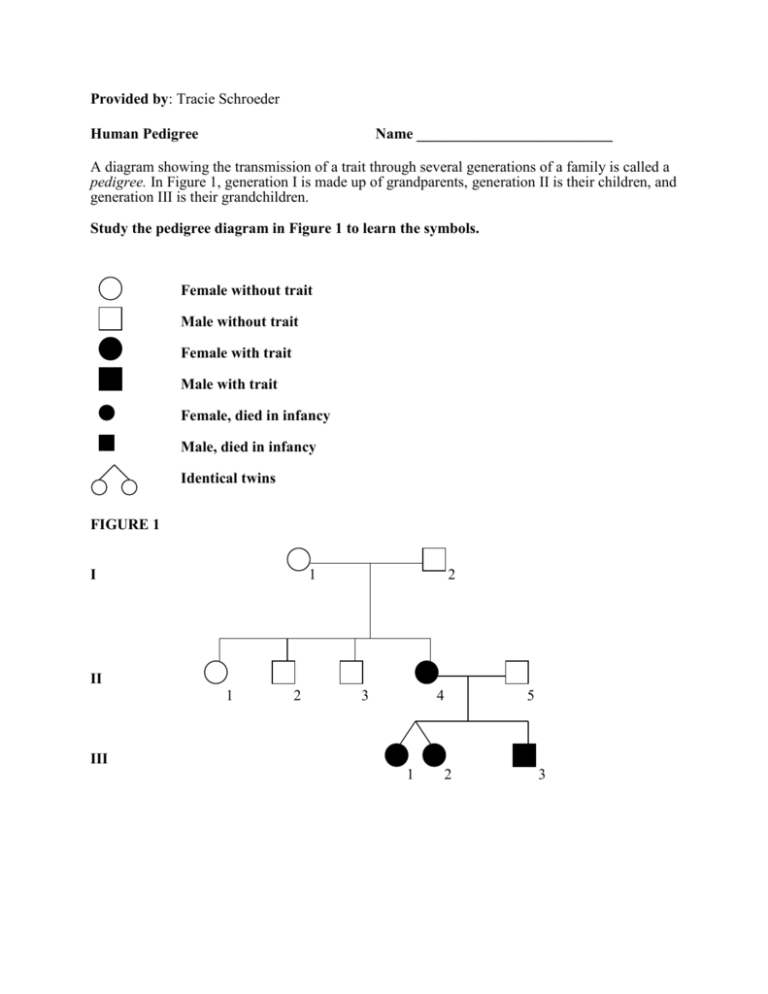
Provided by: Tracie Schroeder Human Pedigree Name __________________________ A diagram showing the transmission of a trait through several generations of a family is called a pedigree. In Figure 1, generation I is made up of grandparents, generation II is their children, and generation III is their grandchildren. Study the pedigree diagram in Figure 1 to learn the symbols. Female without trait Male without trait Female with trait Male with trait Female, died in infancy Male, died in infancy Identical twins FIGURE 1 I 1 2 II 1 2 3 4 5 III 1 2 3 Provided by: Tracie Schroeder Individuals who lack an enzyme needed to form the skin pigment melanin are called albinos. Normal skin pigmentation is dominant. Use D to represent the gene for normal skin and dd to represent the genotype for albinism. Where you cannot be sure whether an idividual with the dominant trait is heterozygous or homozygous, show the genotype as D-. FIGURE 2 Genotype I 1 ________ 2 ________ 3 ________ 4 ________ II 1 ________ 2 ________ 3 ________ 4 ________ 5 ________ 6 ________ 7 ________ III 1 ________ 2 ________ Provided by: Tracie Schroeder Individuals who can taste the chemical phenylthiocarbamide, PTC, have the dominant gene, A. Thise with the recessive genes, aa, cannot taste it. Use “A” to represent the gene for a PTC taster, a dominant trait. Use “aa” for the PTC nontaster, the recessive trait. FIGURE 3 Genotype I 1 ________ 2 ________ 3 ________ 4 ________ II 1 ________ 2 ________ 3 ________ 4 ________ 5 ________ 6 ________ 7 ________ 8 ________ III 1 ________ 2 ________ 7 ________ 7 ________ Provided by: Tracie Schroeder Construct a pedigree diagram of your family for one of the traits listed in your Human Inheritance Lab. Pick a trait that is not found in all the members of your family. List as many genotypes as possible. It should include your grandparents, parents and siblings. 1. In the pedigree in Figure 2, if individuals 6 and 7 have another child, what is the chance that it will be an albino? ____________________________________________________________ 2. In Figure 2, are individuals 1 and 2 in generation I homozygous or heterozygous? ______________________________________________________________________________ 3. In the pedigree diagram in Figure 3, if individuals 4 and 5 in generation II have another child, what is the probability that it will be a taster? _______________________________________ 4. In Figure 3, if individual 8 in generation II married a man with genotype AA, what is the probability that she will have a nontaster child? _____________________________________

