Understanding Satellite Imagery
advertisement
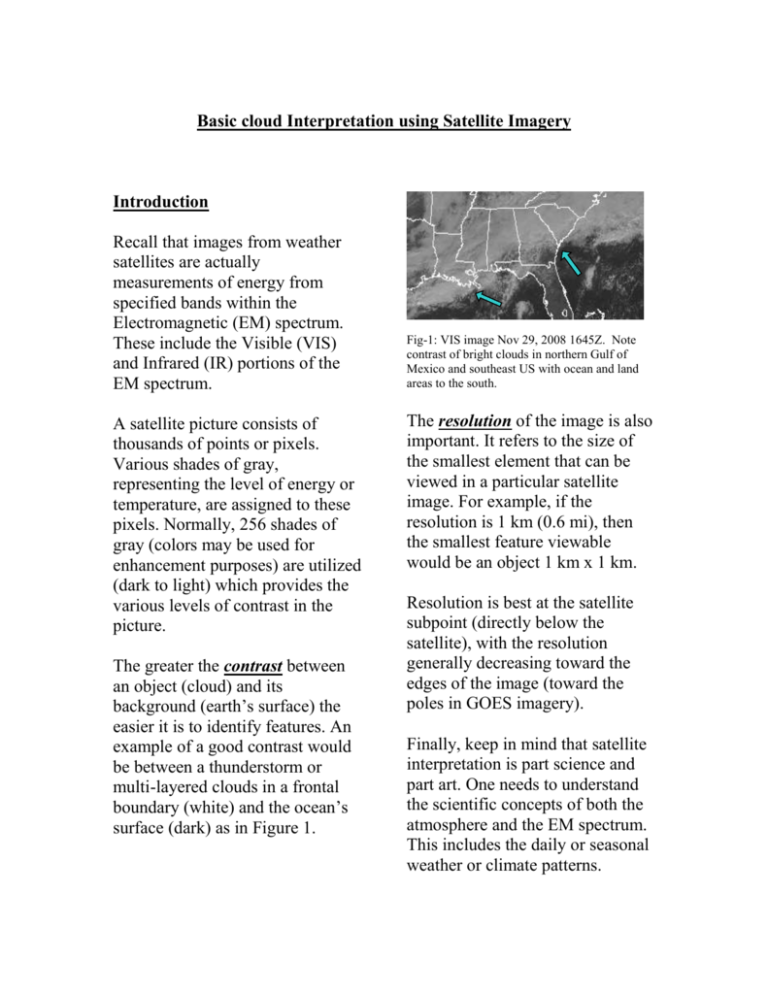
Basic cloud Interpretation using Satellite Imagery Introduction Recall that images from weather satellites are actually measurements of energy from specified bands within the Electromagnetic (EM) spectrum. These include the Visible (VIS) and Infrared (IR) portions of the EM spectrum. A satellite picture consists of thousands of points or pixels. Various shades of gray, representing the level of energy or temperature, are assigned to these pixels. Normally, 256 shades of gray (colors may be used for enhancement purposes) are utilized (dark to light) which provides the various levels of contrast in the picture. The greater the contrast between an object (cloud) and its background (earth’s surface) the easier it is to identify features. An example of a good contrast would be between a thunderstorm or multi-layered clouds in a frontal boundary (white) and the ocean’s surface (dark) as in Figure 1. Fig-1: VIS image Nov 29, 2008 1645Z. Note contrast of bright clouds in northern Gulf of Mexico and southeast US with ocean and land areas to the south. The resolution of the image is also important. It refers to the size of the smallest element that can be viewed in a particular satellite image. For example, if the resolution is 1 km (0.6 mi), then the smallest feature viewable would be an object 1 km x 1 km. Resolution is best at the satellite subpoint (directly below the satellite), with the resolution generally decreasing toward the edges of the image (toward the poles in GOES imagery). Finally, keep in mind that satellite interpretation is part science and part art. One needs to understand the scientific concepts of both the atmosphere and the EM spectrum. This includes the daily or seasonal weather or climate patterns. For example, along the west coast of the US, severe thunderstorms are rare (not nonexistent). On the other hand, fog is a frequent visitor along the US west coast. This knowledge factors into the process of properly interpreting satellite cloud images. In visible imagery, the oceans and the Great Lakes generally appear dark, as not much energy (solar radiation) is reflected back to the satellite. However, at times a sunglint will be visible on the ocean (Figure 2), especially if the ocean is smooth (light winds). Aspects of Visible Imagery Visible satellite imagery is a depiction of the amount of solar radiation reflected back from the earth and clouds (albedo). Shades of light gray or white are indicative of high reflectivity. Dark shades of gray or black indicate low reflectivity of solar radiation. Based on this information, thunderstorms and extensive areas of thick layered clouds will appear white or very bright gray. These clouds reflect a great amount of the incoming solar radiation. Thinner clouds, such as cirrus, appear light to medium gray as some energy is reflected back to the satellite while some passes through to the earth’s surface. Very thin cirrus may not even be visible as most of the radiation passes through to the earth’s surface. Fig 2 Sunglint over Pacific Ocean on Dec 15, 2008 at 2100z - GOES West. The sunglint is based on the physical law of reflection (Figure 3a) which states that angle of incidence (Θi) = the angle of reflection (Θr). The satellite will need to be lined up with this reflected beam in order to detect the reflected energy. Fig 3a Law of reflection If the ocean surface is rough (ocean waves) the beam may be scattered in other directions and the sunglint will not be visible (Figure 3b). Fig 3b If smooth, the ocean surface acts like a mirror. However waves will result in a disruption of the path of the reflected energy. Another feature in visible imagery is the terminator line. It marks the transition from day to night and moves from east to west. In Figure 4, this line is located across extreme western Africa and the eastern Atlantic. least bright during the early morning and late afternoon due to the lower sun angle. As noted earlier, visible imagery is not available at night. Depending upon sun angle, shadows by and on other clouds or the earth’s surface can be helpful in cloud interpretation. Shadows are only seen in visible imagery. For example, tall clouds may cast shadows on lower clouds (Figure 5) or the ground. Convective clouds (i.e. cumulus or cumulonimbus) create shadows giving them a bumpy appearance. Fig 5 note the shadows cast by layered higher clouds on lower clouds in eastern NY and PA, as well as in Mo, western TN, and southern Canada. Aspects of IR Imagery Fig 4 Dec 15, 2008 1800Z and night has fallen on Africa. Visible imagery is brightest during the midday, due to direct angle of the sun’s illumination. It will be IR imagery depicts the measurement of the energy emitted by the earth, atmosphere and clouds. Based on Wien’s equation, the earth system’s maximum or peak emittance is in the IR band. The range of energy depends upon the temperature of the surface emitting the radiation. Thus the IR image is a depiction of the temperature of the cloud tops as well as the earth’s surface. These temperatures are converted and depicted as shades of gray (or other colors) ranging from white (cold) to black (warm). Based on this information, high cloud tops (cold) will appear white. This is the case with cirrus as well as thunderstorm tops. In fact, sometimes thin cirrus will not show in the visible imagery but will in the IR imagery. Lower level clouds (warmer) will appear as varying shades of dark to medium gray. The warmer oceans and land areas will appear dark gray or black. One thing to keep in mind is that the temperature of the land will vary during the day while the ocean will not. In the early morning, the land will be cool and may be a similar gray shade to the ocean. By afternoon, the land will be warmed by incoming solar radiation with an appropriate change to a darker gray scale while there will be little change in the ocean. These variations will be more pronounced depending upon the season of the year. For example, in the winter the water will generally be darker (oceans retain heat and are warmer) than the land. In the summer, the afternoon heating of the land will be more pronounced with land areas changing from light gray to dark gray (warmer). Again, the major advantage of IR imagery is that it’s available 24 hours a day. However a limitation is that when two features (earth’s surface and fog) have similar temperatures, they will exhibit poor contrast in gray shades. When this occurs, it will be difficult to distinguish between the two. Fog is frequently difficult to detect on the IR image at night. However, comparison with a visible image (when available) or looping techniques (clouds move while the ground doesn’t) will help with image interpretation. Satellite Interpretation using VIS and IR Comparison Based on previous classroom discussions, we created a matrix or table listing the characteristics of cloud types (Appendix 1). The Shades of gray that are commonly associated with these cloud types are listed in this table. Comparison of cloud pictures (digital camera) from the ground looking up with satellite images will be discussed in class. However, this table along with the following brief descriptions, should help in identifying cloud types with satellite imagery. thunderstorms show up white on both the VIS and the IR, and generally have a globular or carrot shape, as in figure 5. However, not every white cloud is a thunderstorm. It’s important to know if the current weather pattern would support thunderstorms. When both are available, VISible and IR imagery should be used to complement each other. In the IR imagery: ---white or light gray shades are areas of high clouds (cold). ---low level clouds (warmer) are dark to medium gray shades, and may be difficult to distinguish from the earth’s surface. In visible imagery: ---white or light gray shades are generally thick clouds (layered or thunderstorms). ---thin clouds (i.e. cirrus) appear as light gray or may be transparent ---low clouds (depending upon thickness) will range from medium to light gray (cumulus), to dark or medium gray for stratocumulus and stratus. ---Thick fog may appear as medium to light gray, depending upon time of day and thickness of cloud. An example of using both VIS and IR would be in monitoring thunderstorms. In general, Fig 5 Vis (left) and IR (right) Feb 18, 2009 2000z. Cloud tops blowing off from wsw to ene with upper level winds (anvils) with carrot shape. The matrix that follows at then end of this section is a general guide to use when learning to interpret satellite imagery. Actual cloud pictures and satellite images will be discussed in the cloud type modules. Determining Cloud Types Figures 6-a (visible) and 6-b (IR) are satellite images from December 22, 2008 at 1545Z. Comparison of the two pictures will be used to determine cloud types. cloud tops suggest showers with cumuliform clouds. Off the US east coast, light gray clouds in the VIS (globular in shape) are medium gray in the IR (relatively warm tops). As a result, these are relatively lower level thick clouds (stratocumulus and cumulus) developing in the cold air moving off the continent and over the warmer ocean (heating from below). In the Gulf of Mexico and across Texas, bright clouds in the VIS are dark gray in the IR. Thus these are low level clouds of stratocumulus and stratus origin. Fig 6 a (top) IR image Fig 6 b (bottom) Visible image Dec 22, 2008 1545Z. The narrow rope cloud in the west central Atlantic is a great example. This narrow line is bright in the VIS (figure 6b) but medium gray in the IR (figure 6 a). This information suggests the tops are not very cold, thus they are not thunderstorms. While associated with a frontal system, the lower Finally, as one moves north into Oklahoma and Kansas, the clouds are bright in both the VIS and IR, suggesting multilayered clouds associated with a developing storm system. These clouds are a mixture of cumuliform and altostratus/altocumulus clouds layered to cirrus. Summary When diagnosing the atmosphere, no one tool suffices. An astute student of the atmospheric sciences uses all available data (surface observations, radar and both visible and IR satellite images). Understanding the scientific concepts of regional climatology, current weather patterns, and strengths and weaknesses of remote sensing is very important if one is to properly use satellite images. A scientific method of learning how to interpret satellite images involves coupling conceptual knowledge of cloud formation with satellite image technology. Compare your visual cloud observations with GOES satellite images. Note how clouds form or dissipate both visually and in satellite imagery. You will soon learn to distinguish fog from cumulus clouds, and thunderstorms from layered stratiform clouds. Appendix I - General cloud description when viewed on satellite Imagery Cloud Type Content Base height above ground Characteristic shape on satellite image Color or tone Visible satellite Color or tone IR satellite Cirrus Ice 20,000 to 40,000 Feet Light gray or white but thin white Cirrostratus Ice 15,000 to 30,000 Feet Thin wispy or smooth. Ground usually visible. Thin veil or sheet like Light gray or white Light gray or white cirrocumulus Ice 15,000 to 30,000 Feet Thin patches Light gray or white Light gray or white Altostratus Water and ice 6,500 to 15,000 Feet Altocumulus Water and ice 6,500 to 15,000 Feet Smooth layered cloud but edges may be ragged Smooth layered cloud but edges may be ragged Medium to light Medium gray gray. May have striations/shadows Medium to light Medium gray gray. May have striations Stratocumulus Water (and ice in winter) 1500 to 6500 Feet Cumulus Water (may have ice) Cumulonimbus Water and ice Nimbostratus Stratus (and fog) Water and ice Water (and ice in winter) Lumpy/cellular. May be in lines or groups with edges touching Lumpy/bumpy. Individual < 6,500 Feet elements visible Globular or < 6,500 feet but carrot shaped. tops can grow to Bumpy. May be in lines and cast > 50,000 Feet shadows. 6,500 Feet or Large area of less but layered smooth cloud up to 20,000 with striations. feet Smooth. Shape frequently < 3000 Feet defined by topography Medium to light gray Light gray to white Dark to medium gray. Sometimes poor contrast between land and cloud. medium to light gray Bright white Bright white Medium to bright gray Medium gray to white Medium gray to white depending upon cloud thickness Dark to medium gray. Frequently poor contrast between cloud and ground use visible to help when available


