Hydrology Lab #1: Rainfall Data Analysis
advertisement

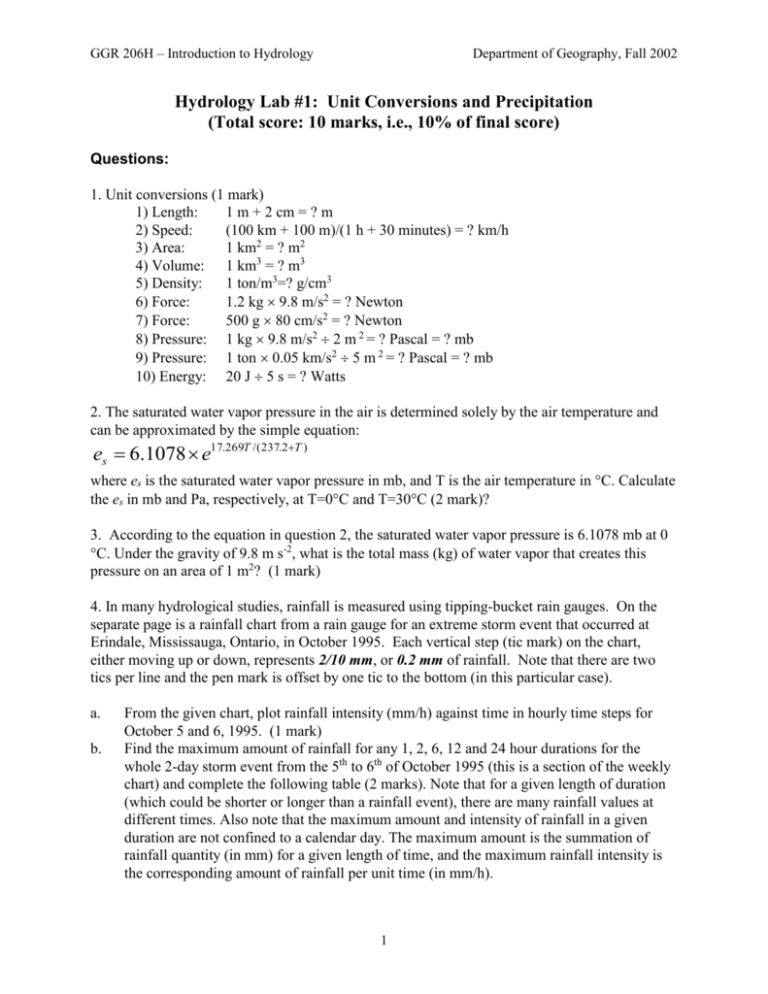
GGR 206H – Introduction to Hydrology Department of Geography, Fall 2002 Hydrology Lab #1: Unit Conversions and Precipitation (Total score: 10 marks, i.e., 10% of final score) Questions: 1. Unit conversions (1 mark) 1) Length: 1 m + 2 cm = ? m 2) Speed: (100 km + 100 m)/(1 h + 30 minutes) = ? km/h 3) Area: 1 km2 = ? m2 4) Volume: 1 km3 = ? m3 5) Density: 1 ton/m3=? g/cm3 6) Force: 1.2 kg 9.8 m/s2 = ? Newton 7) Force: 500 g 80 cm/s2 = ? Newton 8) Pressure: 1 kg 9.8 m/s2 2 m 2 = ? Pascal = ? mb 9) Pressure: 1 ton 0.05 km/s2 5 m 2 = ? Pascal = ? mb 10) Energy: 20 J 5 s = ? Watts 2. The saturated water vapor pressure in the air is determined solely by the air temperature and can be approximated by the simple equation: es 6.1078 e17.269T /(237.2T ) where es is the saturated water vapor pressure in mb, and T is the air temperature in C. Calculate the es in mb and Pa, respectively, at T=0C and T=30C (2 mark)? 3. According to the equation in question 2, the saturated water vapor pressure is 6.1078 mb at 0 C. Under the gravity of 9.8 m s-2, what is the total mass (kg) of water vapor that creates this pressure on an area of 1 m2? (1 mark) 4. In many hydrological studies, rainfall is measured using tipping-bucket rain gauges. On the separate page is a rainfall chart from a rain gauge for an extreme storm event that occurred at Erindale, Mississauga, Ontario, in October 1995. Each vertical step (tic mark) on the chart, either moving up or down, represents 2/10 mm, or 0.2 mm of rainfall. Note that there are two tics per line and the pen mark is offset by one tic to the bottom (in this particular case). a. b. From the given chart, plot rainfall intensity (mm/h) against time in hourly time steps for October 5 and 6, 1995. (1 mark) Find the maximum amount of rainfall for any 1, 2, 6, 12 and 24 hour durations for the whole 2-day storm event from the 5th to 6th of October 1995 (this is a section of the weekly chart) and complete the following table (2 marks). Note that for a given length of duration (which could be shorter or longer than a rainfall event), there are many rainfall values at different times. Also note that the maximum amount and intensity of rainfall in a given duration are not confined to a calendar day. The maximum amount is the summation of rainfall quantity (in mm) for a given length of time, and the maximum rainfall intensity is the corresponding amount of rainfall per unit time (in mm/h). 1 GGR 206H – Introduction to Hydrology Department of Geography, Fall 2002 Table 1: Precipitation Data (Erindale, Mississuaga, Ontario) Duration (min) Maximum Amount of Rain (mm) Maximum Rainfall Intensity (mm/h) 60 120 360 720 1440 c. Plot the maximum amount of rainfall (vertical axis) against duration (horizontal axis) for the event on 4 by 3 cycle log-log paper. (0.5 mark) d. Plot the maximum rainfall intensity in mm/h (vertical axis) against duration (horizontal axis) for the event on 4 by 3 log-log paper. (0.5 mark) 5. From automatically recorded hourly rainfall data in May-September, 2001, at the Erindale campus, Mississauga, we obtained the following maximum rainfall information for various periods. Table 2. Maximum rainfall amounts in different durations 2h 6h 12 h 24 h 5d 10 d 20 d 30 d 60 d 90 d Duration 1 h Max. Rainfall (mm) Plot the maximum amount of rainfall (mm) against duration (1, 2, 6, 12, and 24 hours, 5, 10, 20, 30, 60 and 90 days) on a 4 by 3 cycle log-log paper. Compared with Figure 2-15 in Ward and Robinson (2000), what can you find? (2 marks) Note: Please hand in your original graphs and charts (not photocopies). Show sample calculations where appropriate. 2 GGR 206H – Introduction to Hydrology October 5 Department of Geography, Fall 2002 October 6 3 October 7


