The 1920s Economy: A Statistical Portrait
advertisement
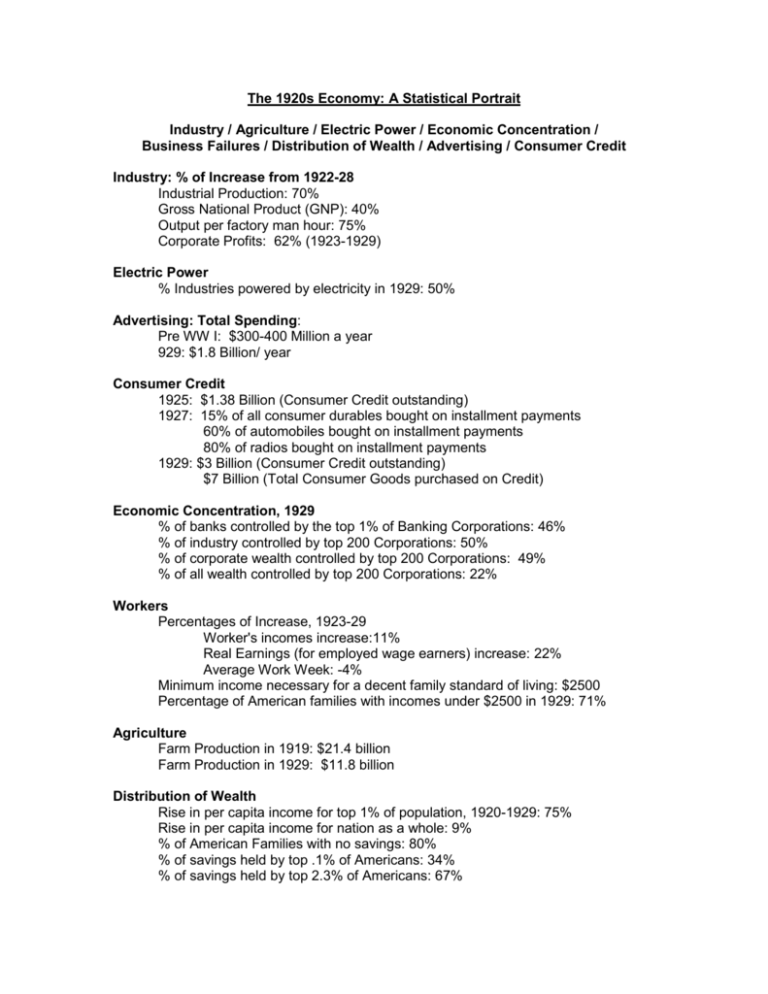
The 1920s Economy: A Statistical Portrait Industry / Agriculture / Electric Power / Economic Concentration / Business Failures / Distribution of Wealth / Advertising / Consumer Credit Industry: % of Increase from 1922-28 Industrial Production: 70% Gross National Product (GNP): 40% Output per factory man hour: 75% Corporate Profits: 62% (1923-1929) Electric Power % Industries powered by electricity in 1929: 50% Advertising: Total Spending: Pre WW I: $300-400 Million a year 929: $1.8 Billion/ year Consumer Credit 1925: $1.38 Billion (Consumer Credit outstanding) 1927: 15% of all consumer durables bought on installment payments 60% of automobiles bought on installment payments 80% of radios bought on installment payments 1929: $3 Billion (Consumer Credit outstanding) $7 Billion (Total Consumer Goods purchased on Credit) Economic Concentration, 1929 % of banks controlled by the top 1% of Banking Corporations: 46% % of industry controlled by top 200 Corporations: 50% % of corporate wealth controlled by top 200 Corporations: 49% % of all wealth controlled by top 200 Corporations: 22% Workers Percentages of Increase, 1923-29 Worker's incomes increase:11% Real Earnings (for employed wage earners) increase: 22% Average Work Week: -4% Minimum income necessary for a decent family standard of living: $2500 Percentage of American families with incomes under $2500 in 1929: 71% Agriculture Farm Production in 1919: $21.4 billion Farm Production in 1929: $11.8 billion Distribution of Wealth Rise in per capita income for top 1% of population, 1920-1929: 75% Rise in per capita income for nation as a whole: 9% % of American Families with no savings: 80% % of savings held by top .1% of Americans: 34% % of savings held by top 2.3% of Americans: 67% Part I: After reviewing the statistical portrait of the 1920s make three generalizations about the economy of the 1920s. Think beyond what is obvious when you process the statistical information and make scholarly statements that interpret the economic trends of the 1920s. 1) ____________________________________________________________________ ______________________________________________________________________ ______________________________________________________________________ 2) ____________________________________________________________________ ______________________________________________________________________ ______________________________________________________________________ 3) ____________________________________________________________________ ______________________________________________________________________ ______________________________________________________________________ Part II: Thesis statements are based on a research question that guides inquiry into a topic. A question that might result from the statistical portrait is: How did the American economy change during the 1920s? Using the information in the statistical portrait, the generalizations you wrote and the research question; write a one sentence thesis statement about the economy of the 1920s. ______________________________________________________________________ ______________________________________________________________________ ______________________________________________________________________ ______________________________________________________________________ ______________________________________________________________________ The rubrics below are for Teacher Evaluation: Basic Proficient Advanced Generalization 1: ____ _____ _____ Generalization 2: ____ _____ _____ Generalization 3: ____ _____ _____ Thesis: _____ Basic: A vague or obvious statement lacking insight _____ Proficient: Limited insight, limited synthesis _____ Advanced: Sophisticated, insightful and demonstrates a synthesis of information
