Epicenter Activity
advertisement
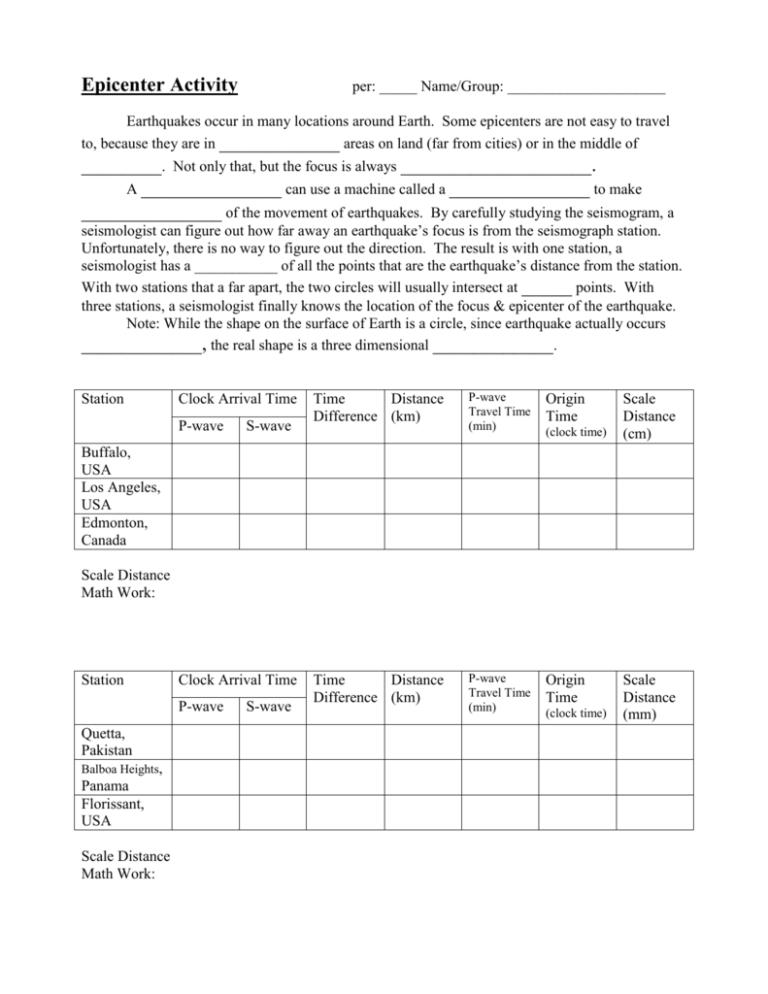
Epicenter Activity per: _____ Name/Group: _____________________ Earthquakes occur in many locations around Earth. Some epicenters are not easy to travel to, because they are in ____________ areas on land (far from cities) or in the middle of ________. Not only that, but the focus is always ___________________. A ______________ can use a machine called a ______________ to make ______________ of the movement of earthquakes. By carefully studying the seismogram, a seismologist can figure out how far away an earthquake’s focus is from the seismograph station. Unfortunately, there is no way to figure out the direction. The result is with one station, a seismologist has a ___________ of all the points that are the earthquake’s distance from the station. With two stations that a far apart, the two circles will usually intersect at _____ points. With three stations, a seismologist finally knows the location of the focus & epicenter of the earthquake. Note: While the shape on the surface of Earth is a circle, since earthquake actually occurs ____________, the real shape is a three dimensional ____________. Station Clock Arrival Time P-wave S-wave Time Distance Difference (km) P-wave Travel Time (min) Origin Time P-wave Travel Time (min) Origin Time (clock time) Scale Distance (cm) Buffalo, USA Los Angeles, USA Edmonton, Canada Scale Distance Math Work: Station Clock Arrival Time P-wave Quetta, Pakistan Balboa Heights, Panama Florissant, USA Scale Distance Math Work: S-wave Time Distance Difference (km) (clock time) Scale Distance (mm) Follow-up Questions 1. Which state in the USA did one of the earthquakes happen in? What was the latitude and longitude of your epicenter? ____________________________________________________________ 2. Where did the other earthquake happen? What was the latitude and longitude of your epicenter? ____________________________________________________________ 3. Why do the circles not match at a single point? ____________________________________________________________ ____________________________________________________________ 4. What do the P and S stand for? How does this let you know which wave is fastest? ____________________________________________________________ 5. Draw a picture of what P-waves look like inside of a rock. 6. Draw a picture of what S-wave look like inside of a rock. 7. How can you remember the kind of motion that an S-wave has? ____________________________________________________________ 8. Which phase has stronger bonds between atoms: liquids or solids? How can you tell? ____________________________________________________________ 9. Why can P-waves travel through liquids, but S-waves can’t? ____________________________________________________________ ____________________________________________________________ ____________________________________________________________ 10. If the scale for a map is 1 cm = 150 km, what will be the scale distance for the earthquake in that is 3,000km away be? Show math ____________________________________________________________ QuickTime™ and a decompressor are needed to see this picture. QuickTime™ and a decompressor are needed to see this picture. Procedures for Epicenter Activity: Filling in the Data Table 1. Record the arrival time of the P- and S-waves at three different seismograph stations. 2. Calculate the difference in arrival times in minutes (decimals are okay). 3. Use the travel-time graph to determine the distance to the focus for each station. a. The travel-time graph shows how far a P-wave and S-wave travel in a given time. b. As you look to the right along the distance-axis (x-axis), the separation between the P- and S-wave arrival times increases. c. Find where the P-S-difference matches the difference from a seismogram. This is the distance to focus. 4. Record the time the P-wave took to travel this distance for each station. 5. Subtract the P-wave travel time from the P-wave arrival time to find out the Origin time of the earthquake. (If you have done your work correctly, the Origin times will almost match.) Finding the Earthquakes Epicenter 6. Use the map’s scale to calculate the scale distance from the seismograph station to the focus for each seismogram. 7. With a ruler draw, a line the length of the scale distance from each station. 8. Place a notebook or piece of cardboard under your copy of the map. 9. Use a drawing compass to draw a circle around each station with a radius of that station’s scale distance. 10. Draw a triangle where you believe the earthquake’s epicenter is. QuickTime™ and a decompressor are needed to see this picture. QuickTime™ and a decompressor are needed to see this picture.

