A Geostatisical Approach for Estimating Rainfall over Mauritius
advertisement

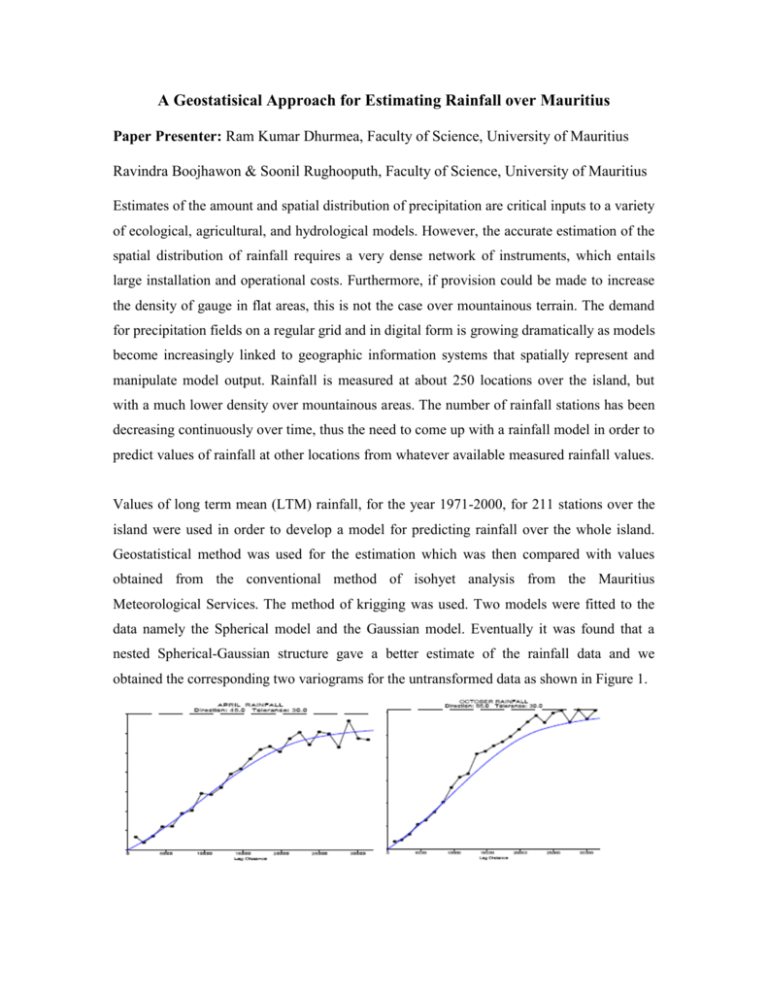
A Geostatisical Approach for Estimating Rainfall over Mauritius Paper Presenter: Ram Kumar Dhurmea, Faculty of Science, University of Mauritius Ravindra Boojhawon & Soonil Rughooputh, Faculty of Science, University of Mauritius Estimates of the amount and spatial distribution of precipitation are critical inputs to a variety of ecological, agricultural, and hydrological models. However, the accurate estimation of the spatial distribution of rainfall requires a very dense network of instruments, which entails large installation and operational costs. Furthermore, if provision could be made to increase the density of gauge in flat areas, this is not the case over mountainous terrain. The demand for precipitation fields on a regular grid and in digital form is growing dramatically as models become increasingly linked to geographic information systems that spatially represent and manipulate model output. Rainfall is measured at about 250 locations over the island, but with a much lower density over mountainous areas. The number of rainfall stations has been decreasing continuously over time, thus the need to come up with a rainfall model in order to predict values of rainfall at other locations from whatever available measured rainfall values. Values of long term mean (LTM) rainfall, for the year 1971-2000, for 211 stations over the island were used in order to develop a model for predicting rainfall over the whole island. Geostatistical method was used for the estimation which was then compared with values obtained from the conventional method of isohyet analysis from the Mauritius Meteorological Services. The method of krigging was used. Two models were fitted to the data namely the Spherical model and the Gaussian model. Eventually it was found that a nested Spherical-Gaussian structure gave a better estimate of the rainfall data and we obtained the corresponding two variograms for the untransformed data as shown in Figure 1. Figure 1: Directional variogram plots with tolerance set to 300 for April and October with a nested Spherical and Gaussian model applied. Initial analysis gave reasonable estimations, but the root mean square error (RMSE) was found to be quite high. An in-depth analysis showed that data was skewed and required transformation in order to have better estimations which proved to reduce the RMSE. Variograms obtained for the transformed data are shown in Figure 2. Figure 2: Directional variogram plots with tolerance set to 30 0 for April and October with a nested Spherical and Gaussian model applied after transformation of data. Nevertheless, it was found that estimation for the summer months of January, February and December differ quite significantly from values obtained using the isohyet analysis. References 1. Barnes, R. Variogram Tutorial. Golden Software Inc. 2. Gringarten, E. Deutsch, C.V. (2001). Variogram interpretation and modeling. Mathematical Geology, Vol.33, No.4. 3. Kitadinis, P.K. (1997). Introduction to geostatistics: Application in hydrogeology. 4. Kyriadikis, P.C., Kim, J., Miller, N.L. (2001). Geostatistical mapping of precipitation from rain gauge data using atmospheric and terrain characteristics. Journal of Applied Meteorology, Vol. 40.


