Problem Set #2
advertisement
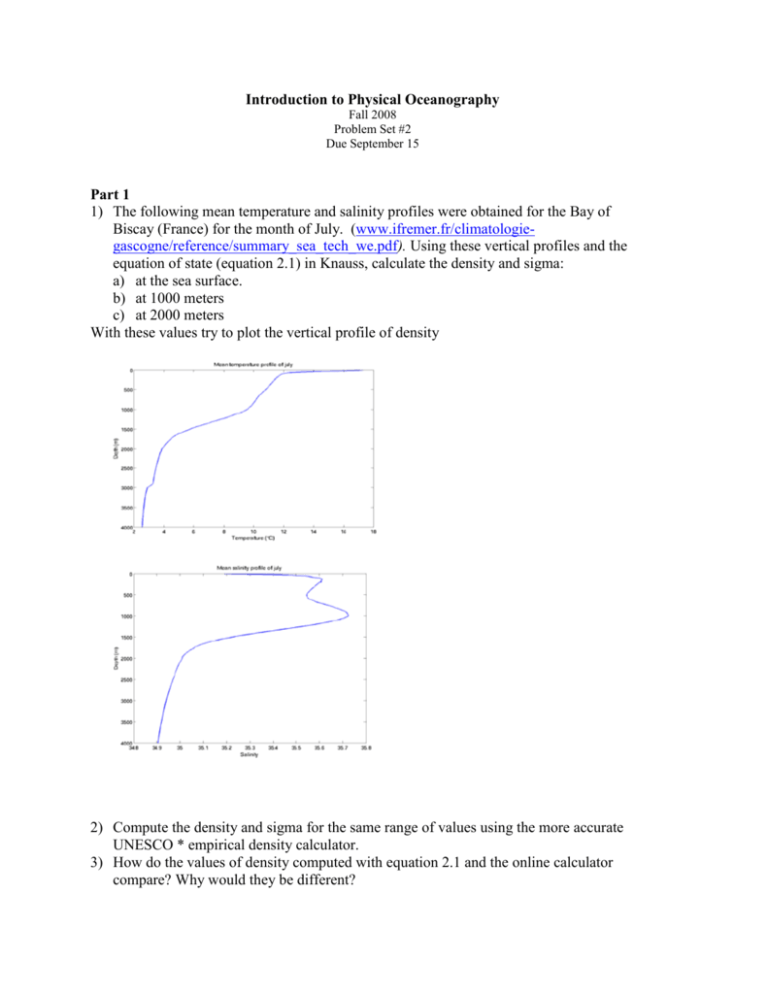
Introduction to Physical Oceanography Fall 2008 Problem Set #2 Due September 15 Part 1 1) The following mean temperature and salinity profiles were obtained for the Bay of Biscay (France) for the month of July. (www.ifremer.fr/climatologiegascogne/reference/summary_sea_tech_we.pdf). Using these vertical profiles and the equation of state (equation 2.1) in Knauss, calculate the density and sigma: a) at the sea surface. b) at 1000 meters c) at 2000 meters With these values try to plot the vertical profile of density 2) Compute the density and sigma for the same range of values using the more accurate UNESCO * empirical density calculator. 3) How do the values of density computed with equation 2.1 and the online calculator compare? Why would they be different? 4) Locate the 3 points from Question 1 on the TS diagram below (Contours are of sigma). Part 2 Compute the following from equation 2.1 in Knauss: 5) b) c) T S p 6) Based on these values (in Q5), how much would temperature have to change to cause the same change in density as a change in salinity of 1 psu if Temperature and salinity were as in Q1a? and in Q1b?. What would your answer be if you used the TS diagram above? a) *http://www.phys.ocean.dal.ca/~kelley/seawater/density.html *http://fermi.jhuapl.edu/denscalc.html *http://ioc.unesco.org/Oceanteacher/oceanteacher2/01_GlobOcToday/02_CollDta/02_OcDtaFunda/02_OcMeasUnits/SWeq uationofstatecalculator.htm
