Exam III
advertisement
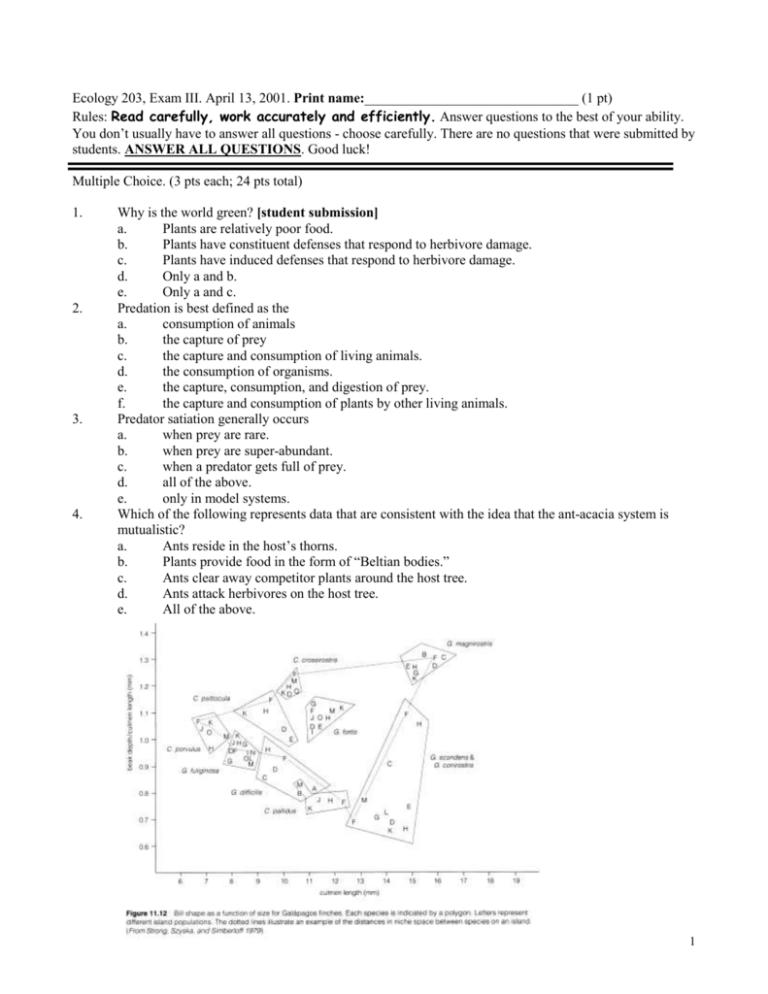
Ecology 203, Exam III. April 13, 2001. Print name:_______________________________ (1 pt) Rules: Read carefully, work accurately and efficiently. Answer questions to the best of your ability. You don’t usually have to answer all questions - choose carefully. There are no questions that were submitted by students. ANSWER ALL QUESTIONS. Good luck! Multiple Choice. (3 pts each; 24 pts total) 1. 2. 3. 4. Why is the world green? [student submission] a. Plants are relatively poor food. b. Plants have constituent defenses that respond to herbivore damage. c. Plants have induced defenses that respond to herbivore damage. d. Only a and b. e. Only a and c. Predation is best defined as the a. consumption of animals b. the capture of prey c. the capture and consumption of living animals. d. the consumption of organisms. e. the capture, consumption, and digestion of prey. f. the capture and consumption of plants by other living animals. Predator satiation generally occurs a. when prey are rare. b. when prey are super-abundant. c. when a predator gets full of prey. d. all of the above. e. only in model systems. Which of the following represents data that are consistent with the idea that the ant-acacia system is mutualistic? a. Ants reside in the host’s thorns. b. Plants provide food in the form of “Beltian bodies.” c. Ants clear away competitor plants around the host tree. d. Ants attack herbivores on the host tree. e. All of the above. 1 5. 6. 7. 8. The graph on the previous page suggests beak sizes of finches on the Galapagos a. vary among the different islands. b. vary within islands. c. are different on similar islands. d. a and b. e. a, b, and c. Species Comm. A The diversity index for the community on the right is (note that 1 20 H’ = -(pi*ln(pi) and that the number under “Comm. A” 2 30 is the number of individuals in each species.) 3 40 a. 0.50 4 50 b. 0.66 c. 1.10 d. 1.33 e. 1.66 Which of the following are facts about species diversity (circle all those that are true). a. Species richness increases with latitude. b. Species richness increases with altitude c. Species richness decreases with latitude. d. Species richness decreases with area. e. Species richness increases with latitude but decreases with altitude. Steve Hubbell, in the video, suggested that there are so many species of tropical trees because a. of the limitation of seed dispersal. b. seed predators eat seeds (and seedlings) near parent trees. c. seed predators reduce tree fecundity allow other species to seed in under trees. d. disturbances allow opportunities for many species to get started. e. resources in the tropics are abundant. Short Answers. (5 pts each; 65 pts total) 1. Fill in the table of interactions below. Use “+,” “-,” “0,” or “NA” for “not applicable.” Species/Individual A Competition Predation Mutualism Commensalism Amensalism Herbivory 2. ____________________________ ____________________________ ____________________________ ____________________________ ____________________________ ____________________________ Species/Individual B ______________________ ______________________ ______________________ ______________________ ______________________ ______________________ Provide a bar graph of the relationship between “response to competition” and “asymmetry.” Explain. 2 3. Thomas Park’s work on flour beetles showed that under one type of condition one species won in competition while in another condition the other beetle won in competition. What were the conditions and what is the significance of this result? Factors used by Park = ____________________ and ___________________. Significance of the main result described above: 4. What are the two main approaches to testing for the presence of competition between species in the field? What problems are associated with each of these methods? Approach 5. Problems with approach 1. _____________________________ ___________________________________ ___________________________________ ___________________________________ ___________________________________ 2. _____________________________ ___________________________________ ___________________________________ ___________________________________ ___________________________________ Competition may result in character displacement after many generations. Make a frequency histogram of a generalized character (perhaps beak depth) for two species on a single axis. Draw two additional frequency histograms below this graph: one showing how competition would have led to the current pattern and one where a different factor led to the current pattern. Label your graphs clearly. Write in the margin what the mechanism is that you have drawn. 3 6. Analyze the competition graph below. (Hint: “analyze the graph”) N1 00 K1 N2 7. For the above model create a single graph of N as a function of time for both species. Use the dot in the above example as your starting condition. 8. Analyze the predator (P)-prey (H) graph below. P . H 4 9. For the above model create a single graph of N as a function of time for both species. Use the dot in the above example as your starting condition. 10. Graph the herbivore optimization hypothesis. Label your axes clearly. Why might you expect this response? 11. Provide a graph below that would support the idea that pathogens do not evolve toward benign coexistence. Briefly explain. 5 12. What is the significance of the following graph? 13. Reconstruct the graphical version of the theory of island biogeography below. Graph the rate as a function of the number of species. Identify equilibria for islands that are in all possible combinations of small, large, near, and far. 1. Below is the model for competition, consisting of two coupled differential equations. (2 pts.,10 pts total) dN1/dt = r1N1((K1 - N1 - 12)/K1) and dN2/dt = r2N2 ((K2 - N2 - 21)/K2) a. Briefly define “dN1/dt.” b. Briefly define “12.” c. What does it mean if 12 < 1. d. What are the three equilibria in the first equation? e. What mathematical condition leads to coexistence in the above set of equations? 6


