Name: Period: _____ CHAPTER 8 TEST REVIEW (MUST SHOW
advertisement
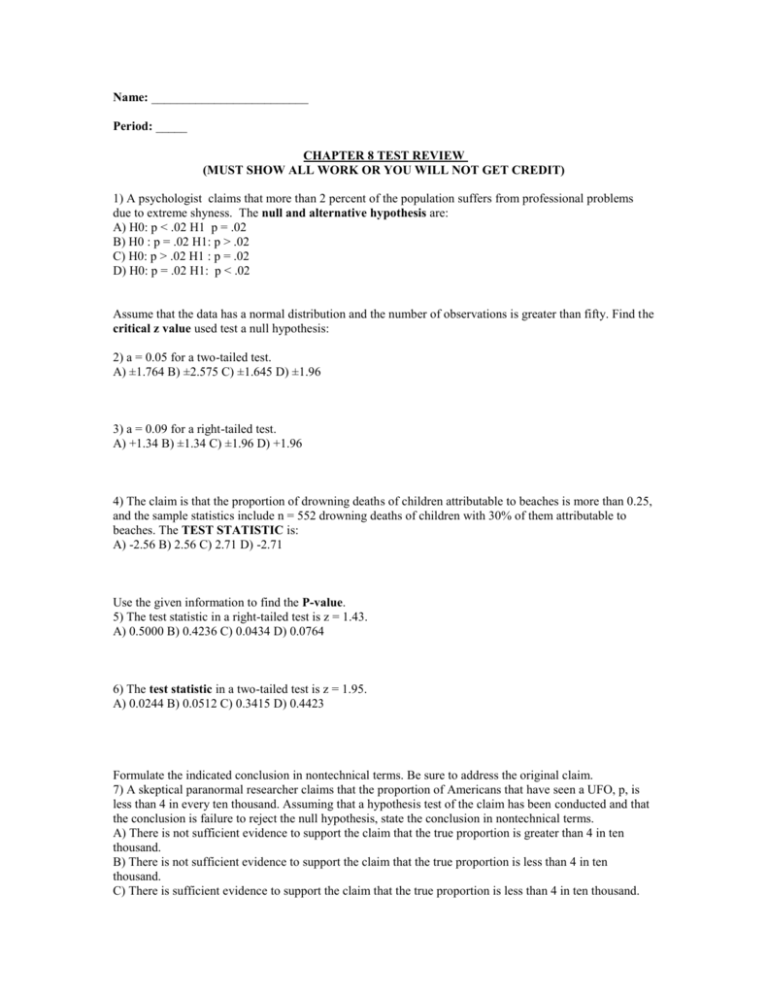
Name: _________________________ Period: _____ CHAPTER 8 TEST REVIEW (MUST SHOW ALL WORK OR YOU WILL NOT GET CREDIT) 1) A psychologist claims that more than 2 percent of the population suffers from professional problems due to extreme shyness. The null and alternative hypothesis are: A) H0: p < .02 H1 p = .02 B) H0 : p = .02 H1: p > .02 C) H0: p > .02 H1 : p = .02 D) H0: p = .02 H1: p < .02 Assume that the data has a normal distribution and the number of observations is greater than fifty. Find the critical z value used test a null hypothesis: 2) a = 0.05 for a two-tailed test. A) ±1.764 B) ±2.575 C) ±1.645 D) ±1.96 3) a = 0.09 for a right-tailed test. A) +1.34 B) ±1.34 C) ±1.96 D) +1.96 4) The claim is that the proportion of drowning deaths of children attributable to beaches is more than 0.25, and the sample statistics include n = 552 drowning deaths of children with 30% of them attributable to beaches. The TEST STATISTIC is: A) -2.56 B) 2.56 C) 2.71 D) -2.71 Use the given information to find the P-value. 5) The test statistic in a right-tailed test is z = 1.43. A) 0.5000 B) 0.4236 C) 0.0434 D) 0.0764 6) The test statistic in a two-tailed test is z = 1.95. A) 0.0244 B) 0.0512 C) 0.3415 D) 0.4423 Formulate the indicated conclusion in nontechnical terms. Be sure to address the original claim. 7) A skeptical paranormal researcher claims that the proportion of Americans that have seen a UFO, p, is less than 4 in every ten thousand. Assuming that a hypothesis test of the claim has been conducted and that the conclusion is failure to reject the null hypothesis, state the conclusion in nontechnical terms. A) There is not sufficient evidence to support the claim that the true proportion is greater than 4 in ten thousand. B) There is not sufficient evidence to support the claim that the true proportion is less than 4 in ten thousand. C) There is sufficient evidence to support the claim that the true proportion is less than 4 in ten thousand. D) There is sufficient evidence to support the claim that the true proportion is greater than 4 in ten thousand. 8) Carter Motor Company claims that its new sedan, the Libra, will average better than 28 miles per gallon in the city. Identify the type I error for the test. A) The error of rejecting H0 that the mean is at most (<=) 28 miles per gallon when it really is at most 28 miles per gallon. B) The error of failing to reject the claim that the mean is at most 25 miles per gallon when it is actually greater than 25 miles per gallon. C) The error of rejecting the claim that the true proportion is more than 28 miles per gallon when it really is more than 28 miles per gallon. 9) A skeptical paranormal researcher claims that the proportion of Americans that have seen a UFO, p, is less than 3 in every one thousand. Identify the type II error for the test. A) The error of rejecting the claim that the true proportion is less than 3 in one thousand when it really is less than 3 in one thousand. B) The error of rejecting the claim that the true proportion is at least 3 in one thousand when it really is at least 3 in one thousand. C) The error of failing to reject H0 that the true proportion is at least 3 in one thousand when it is actually less than 3 in one thousand. SHORT ANSWER. Write the word or phrase that best completes each statement or answers the question. Identify the null hypothesis, alternative hypothesis, test statistic, P-value, conclusion about the null hypothesis, and final conclusion that addresses the original claim. 10) A poll of 1,068 adult Americans reveals that 48% of the voters surveyed prefer the Democratic candidate for the presidency. At the 0.05 level of significance, test the claim that at least half of all voters prefer the Democrat. 11) In a sample of 167 children selected randomly from one town, it is found that 37 of them suffer from asthma. At the 0.05 significance level, test the claim that the proportion of all children in the town who suffer from asthma is 11%. SHORT ANSWER. Write the word or phrase that best completes each statement or answers the question. Identify the null hypothesis, alternative hypothesis, test statistic, P-value, conclusion about the null hypothesis, and final conclusion that addresses the original claim. 12) A ramdom sample of 100 pumpkins is obtained and the mean circumference is found to be 40.5 cm. Assuming that the population standard deviation is known to be 1.6 cm, use a 0.10 significance level to test the claim that the mean circumference of all pumpkins is equal to 39.9 cm. Test the given claim using the traditional method of hypothesis testing. Assume that the sample has been randomly selected from a population with a normal distribution. 13) A large software company gives job applicants a test of programming ability and the mean for that test has been 160 in the past. Twenty-five job applicants are randomly selected from one large university and they produce a mean score and standard deviation of 183 and 12, respectively. Use a 0.05 level of significance to test the claim that this sample comes from a population with a mean score greater than 160. 14) A manufacturer uses a new production method to produce steel rods. A random sample of 17 rods resulted in lengths with a standard deviation of 2.1 cm. At the 0.05 significance level, test the claim that the new production method has lengths with a standard deviation different from 3.5 cm, which was the standard deviation from the old method. Use both the traditional and p-value method to test the claim. ANSWERS 1) B 2) D 3) A 4) C 5) D 6) B 7) B 8) A 9) C 10) H0 : p = 0.5. H1 : p < 0.5. Test statistic: z = -1.31. P-value: p = 0.0951. Critical value: z = -1.645. Fail to reject null hypothesis. There is not sufficient evidence to warrant rejection of the claim that at least half of all voters prefer the Democrat. 11) H0 : p = 0.11. H1: p ≠ 0.11. Test statistic: z = 4.61. P-value: p = 0.0001. Critical values: z = ±1.96. Reject null hypothesis. There is sufficient evidence to warrant rejection of the claim that the proportion of all children in the town who suffer from asthma is 11%. 12) H0: m = 39.9; H1: m ≠ 39.9. Test statistic: 3.75. P-value: 0.0002. Reject H0; There is sufficient evidence to warrant rejection of the claim that the mean equals 39.9 cm. 13) Test statistic: t = 9.583. Critical value: t = 1.711. Reject the null hypothesis. There is sufficient evidence to support the claim that the mean is greater than 160. 14) From Table A-4, using 16 degrees of freedom and .025 and .975 areas, the critical values are 6.908 and 28.845. Our test statistic is 5.76; it is more extreme, so we reject the null. There is sufficient evidence to support the claim that the new production method has lengths with a standard deviation different from 3.5 cm. Our P-Value (which, because it is a two tailed test and our test statistic is smaller than the degrees of freedom(5.76 is smaller than 16), we look at the area to the left of the test statistic to retrieve our p-value: X^2cdf(0, 5.76, 16)) is smaller than .05, thus we reject the null hypothesis.


