HR diagram task and answers to questions
advertisement
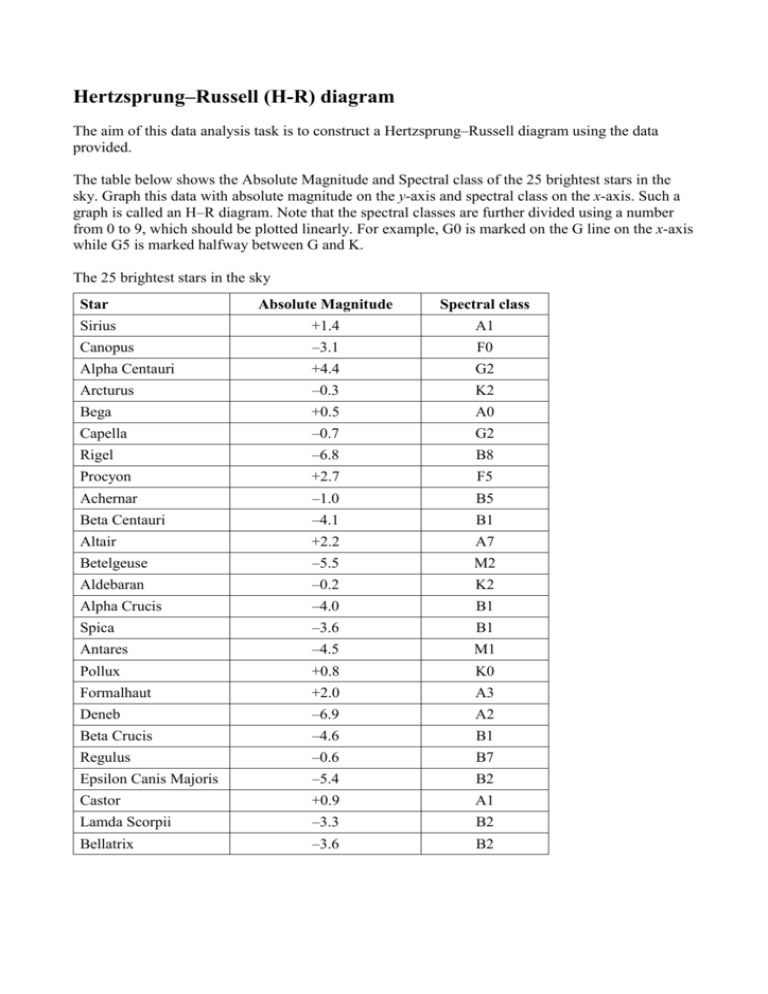
Hertzsprung–Russell (H-R) diagram The aim of this data analysis task is to construct a Hertzsprung–Russell diagram using the data provided. The table below shows the Absolute Magnitude and Spectral class of the 25 brightest stars in the sky. Graph this data with absolute magnitude on the y-axis and spectral class on the x-axis. Such a graph is called an H–R diagram. Note that the spectral classes are further divided using a number from 0 to 9, which should be plotted linearly. For example, G0 is marked on the G line on the x-axis while G5 is marked halfway between G and K. The 25 brightest stars in the sky Star Absolute Magnitude Spectral class Sirius +1.4 A1 Canopus –3.1 F0 Alpha Centauri +4.4 G2 Arcturus –0.3 K2 Bega +0.5 A0 Capella –0.7 G2 Rigel –6.8 B8 Procyon +2.7 F5 Achernar –1.0 B5 Beta Centauri –4.1 B1 Altair +2.2 A7 Betelgeuse –5.5 M2 Aldebaran –0.2 K2 Alpha Crucis –4.0 B1 Spica –3.6 B1 Antares –4.5 M1 Pollux +0.8 K0 Formalhaut +2.0 A3 Deneb –6.9 A2 Beta Crucis –4.6 B1 Regulus –0.6 B7 Epsilon Canis Majoris –5.4 B2 Castor +0.9 A1 Lamda Scorpii –3.3 B2 Bellatrix –3.6 B2 Questions Answer the following questions about your graph: 1. Can you distinguish a main sequence in this H–R diagram? Label it. 2. Circle the two supergiant stars. 3. What types of stars are missing from this diagram? Why are they missing? ________________________________________________________________________________ ________________________________________________________________________________ ________________________________________________________________________________ ________________________________________________________________________________ 4. Is this a representative sample of stars in the sky? Explain. ________________________________________________________________________________ ________________________________________________________________________________ 5. What is the most common spectral class on your diagram? ________________________________________________________________________________ 6. Insert the Sun on your diagram and explain its colour and temperature. (The Sun is type G2, M = +4.8). ________________________________________________________________________________ ________________________________________________________________________________ ________________________________________________________________________________ 7. Of the stars on your graph, which two have the highest positive numbers for their absolute magnitude? What is significant about these two stars? ________________________________________________________________________________ ________________________________________________________________________________ Answers Q1 & 2 HR diagram -10 -8 TWO SUPERGIANTS -6 -4 MAIN SEQUENCE Magnitude -2 0 2 4 NO WHITE DWARFS 6 SUN N 8 Spectral Class 10 O B A F G K M 3. What types of stars are missing from this diagram? Why? white dwarfs not very bright M > 10 lower part of main sequence M > 10 4. Is this a representative sample of stars in the sky? Explain. It is a reasonable representation, but lots of faint stars are missing. 5. What is the most common spectral class on your diagram? B group 6. Insert the Sun on your diagram and explain its colour and temperature. (The Sun is type G2, M = +4.9). G2 stars are yellow, surface temp = 5000 6000 K 7. Of the stars on your graph, which two have the highest positive numbers for their absolute magnitude? What is significant about these two stars? Alpha centauri +4.4 & the Sun +4.9 These two stars are the closest to Earth.
