314ExJul(E)_07
advertisement
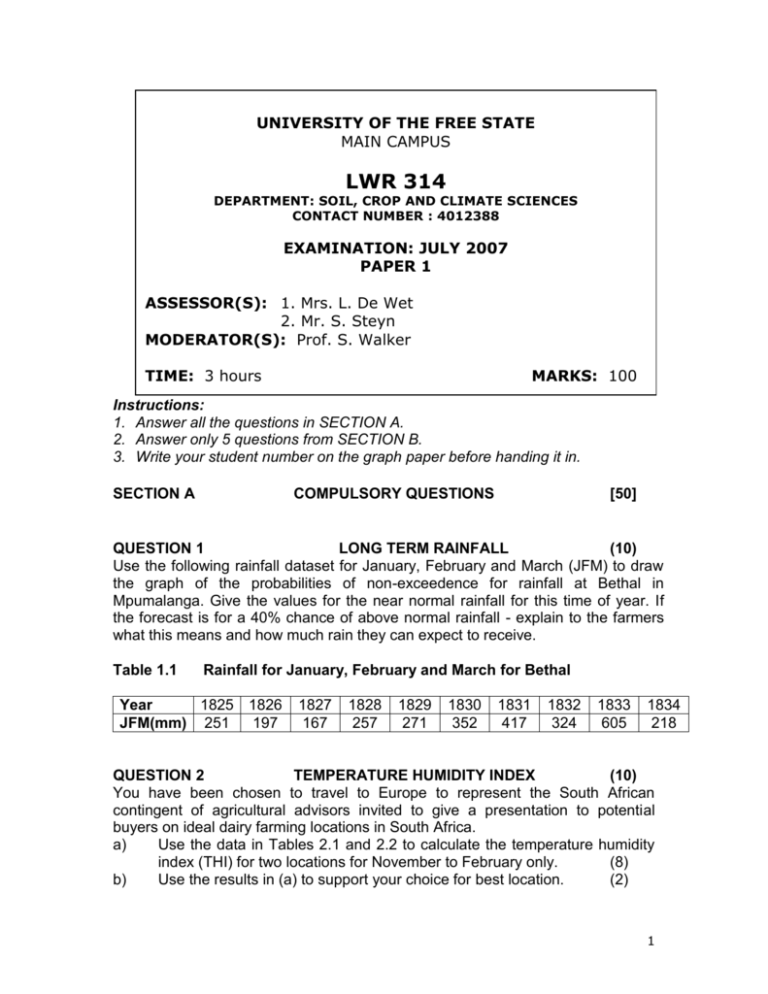
UNIVERSITY OF THE FREE STATE MAIN CAMPUS LWR 314 DEPARTMENT: SOIL, CROP AND CLIMATE SCIENCES CONTACT NUMBER : 4012388 EXAMINATION: JULY 2007 PAPER 1 ASSESSOR(S): 1. Mrs. L. De Wet 2. Mr. S. Steyn MODERATOR(S): Prof. S. Walker TIME: 3 hours MARKS: 100 Instructions: 1. Answer all the questions in SECTION A. 2. Answer only 5 questions from SECTION B. 3. Write your student number on the graph paper before handing it in. SECTION A COMPULSORY QUESTIONS [50] QUESTION 1 LONG TERM RAINFALL (10) Use the following rainfall dataset for January, February and March (JFM) to draw the graph of the probabilities of non-exceedence for rainfall at Bethal in Mpumalanga. Give the values for the near normal rainfall for this time of year. If the forecast is for a 40% chance of above normal rainfall - explain to the farmers what this means and how much rain they can expect to receive. Table 1.1 Rainfall for January, February and March for Bethal Year 1825 1826 JFM(mm) 251 197 1827 167 1828 257 1829 271 1830 352 1831 417 1832 324 1833 605 1834 218 QUESTION 2 TEMPERATURE HUMIDITY INDEX (10) You have been chosen to travel to Europe to represent the South African contingent of agricultural advisors invited to give a presentation to potential buyers on ideal dairy farming locations in South Africa. a) Use the data in Tables 2.1 and 2.2 to calculate the temperature humidity index (THI) for two locations for November to February only. (8) b) Use the results in (a) to support your choice for best location. (2) 1 Table 2.1 Location Tmx RHmn es e Td THI Climate data for location A o C % kPa kPa o C Table 2.2 o JAN FEB 27.5 27.2 19.0 20.7 3.7 3.6 0.7 0.7 24.9 20.6 16.3 23.0 28.0 28.6 3.1 2.4 1.9 0.7 0.7 0.5 13.1 12.8 14.6 36.0 33.9 28.6 1.5 1.5 1.7 0.5 0.5 0.5 17.5 26.7 2.0 0.5 20.9 21.7 2.5 0.5 23.7 20.2 2.9 0.6 26.1 20.8 3.4 0.7 1.8 2.4 67 -1.6 54 -1.8 58 -1.8 61 -0.4 2.0 2.8 1.5 62 -1.9 57 -2.7 53 -3.4 55 Climate data for location B Location B Tmx RHmn es e o Td THI o 1459 m 32 23'S 20 40'E 57y MAR APR MAY JUN JUL AUG SEP OCT NOV DEC A C % kPa kPa o C o o JAN FEB 1304 m 28 57'S 26 20E 76y MAR APR MAY JUN JUL AUG SEP OCT NOV DEC 30.9 29.4 21.4 26.9 4.5 4.1 1.0 1.1 27.2 23.8 20.6 27.5 25.7 21.8 3.6 2.9 2.4 1.0 0.8 0.5 17.5 17.7 20.6 23.3 20.8 18.5 2.0 2.0 2.4 0.5 0.4 0.4 24.5 18.5 3.1 0.6 26.8 20.6 3.5 0.7 28.4 22.0 3.9 0.9 30.3 20.4 4.3 0.9 6.3 6.9 71 -3.7 57 -1.0 65 2.4 69 4.6 5.1 8.4 3.0 66 -2.0 61 -5.0 57 -4.2 60 QUESTION 3 EVAPOTRANSPIRATION (10) Make use of the two figures to explain the influence of maximum and minimum temperature on the potential evapotranspiration. Compare the Priestly-Taylor and Penman-Monteith methods giving reasons for the observed variations. ETo PenMon (mm/d) 8 7 y = 0.1937x + 1.7585 R2 = 0.7327 y = 0.2298x - 2.7206 R2 = 0.5878 6 5 4 3 2 1 0 -2 3 8 13 18 23 28 33 Tm in or Tm ax (C) 2 ETo Priestly-Taylor (mm/d) 8 7 6 5 y = 0.9233x - 0.2285 R2 = 0.8517 4 3 2 1 0 0 1 2 3 4 5 6 7 8 ETo Pen-Mon (m m /d) QUESTION 4 REMOTE SENSING (20) a) Describe how LANDSAT-7 satellite imagery can be used to identify and monitor the state of agricultural crop production in a certain region. (7) b) Study the Radar image in Figure 4.1. What type of weather is occurring between Bloemfontein and Kimberley at the time of the image? Motivate your answer by referring to the observed reflectivities, associated rainfall rate, special echo structures and your theoretical knowledge of rainfall-producing weather systems. (5) Figure 4.1: Radar reflectivity image of the southern Free State area at 14:30 UTC on 2006-10-19 (copyright, SAWS). 3 c) Identify the cloud types marked A to D on the satellite images in Figures 4.2 to 4.4. In each case state the reasoning behind your decision. (8) C A A B A D A Figure 4.2: Visual satellite image of Southern Africa at 06:00 UTC on 2006-10-12 (copyright 2006, EUMETSAT) Figure 4.3: Water vapour satellite image of Southern Africa at 06:00 UTC on 2006-10-12 (copyright 2006, EUMETSAT) 4 Figure 4.4: Infrared satellite image of Southern Africa at 06:00 UTC on 2006-10-12 (copyright 2006, EUMETSAT) ________________________________________________________________ SECTION B CHOICE QUESTIONS [50] You must answer 5 questions from this section. Choose between: QUESTION 5 OR QUESTION 6 QUESTION 7 OR QUESTION 8 QUESTION 9 OR QUESTION 10 QUESTION 11 OR QUESTION 12 QUESTION 13 OR QUESTION 14 AND AND AND AND QUESTION 5 IRRIGATION (10) You have used SapWat to calculate the irrigation schedule for your wheat crop that was planted on 1 June. The results you obtained are shown below in the graph. The lower limit for the soil is at 80 mm and the drained upper limit is 140 mm. Compare the amount of rainfall received and the evapotranspiration (ETc) 5 demand - use the monthly values to explain when you will need to irrigate. Compare the soil water content under the 2 different types of irrigation schedule – where 25 mm of water is applied every 7 days versus varying applications in each of the 4 stages (15 mm every 7 days; then 25 mm every 6 days; then 25 mm every 5 days; then 25 mm every 8 days). Discuss the effect on your wheat crop and explain which is the better irrigation schedule. effective rain 180 ETc 160 140 ETc or Rain (mm/month) 120 100 80 60 40 20 0 Jun Jul Aug Sept Tim e Oct Nov 7d25mm 140 130 120 Soil Water (mm) 4stage 110 100 90 80 70 60 50 0 20 40 60 80 100 Time (days) 120 140 160 OR QUESTION 6 DROUGHT (10) You are asked to manage the drought plan for the farming community around Gariep Dam. Give details of which key groups you will invite to serve on the ‘Drought Task Force’. List at least 5 of the most important purposes of the ‘Drought Plan’. 6 AND QUESTION 7 PESTS AND DISEASES (10) Prediction results are provided in Table 7.1 for a warning index using accumulated favourable hours as input. Favourable hours were calculated using weather variables typical of cool, wet weather. Predicted severity was then plotted against observed disease severity (Figure 7.1). Use the data provided and explain how you propose this warning index was developed. Which weather variables were needed for the disease and how would you apply the available results? Table 7.1 Results for prediction of disease severity and accumulated favourable hours calculated for a location where crop disease proved to be a problem for farmers Date 1-Sep-04 2-Sep-04 3-Sep-04 4-Sep-04 5-Sep-04 6-Sep-04 7-Sep-04 8-Sep-04 9-Sep-04 10-Sep-04 11-Sep-04 12-Sep-04 13-Sep-04 14-Sep-04 15-Sep-04 Favourable hours 294 300 364 403 444 469 509 512 550 558 569 580 594 600 602 Disease severity Observed Predicted 10.0 19.0 20.0 20.5 30.0 35.9 40.0 45.3 45.0 55.1 50.0 61.2 60.0 70.8 66.0 71.5 69.0 80.7 70.0 82.6 75.0 85.3 80.0 87.9 90.0 91.3 90.0 92.7 100.0 93.2 7 Predicted dis severity (%) 100.0 80.0 60.0 Linear (Series1) y = 0.9441x + 9.8612 R2 = 0.9604 40.0 20.0 0.0 0.0 20.0 40.0 60.0 80.0 100.0 Observed dis sev (%) Figure 7.1 Observed vs predicted disease severity using accumulated favourable hours from inoculation on 25 July 2004. OR QUESTION 8 FROST (10) Study Table 8.1 which shows long term maximum (Tmx) and minimum (Tmn) temperatures and altitudes for three different stations in South Africa for the winter months June to August. a) Use your knowledge of frost to describe frost in general as related to the environment. (4) b) Discuss frost occurrence at the different stations in Table 8.1 using the available data and refer to terms such as climate, topography and surrounding environment to motivate and explain your answers. (6) Table 8.1 Locations Alt (m) o Ta ( C) Jun Month Jul Aug Long term maximum (Tmx) and minimum (Tmn) temperatures for Stations A, B, C and D at different altitudes for the months June to August Station A 1690 Tmn -2.6 -2.8 -9.3 Tmx 15.3 16.2 18.1 Station B 1345 Tmn 0.4 0.3 3.1 Tmx 18.8 19 22.1 Station C 1065 Tmn -0.3 -0.5 2.9 Tmx 21.5 22.1 24.9 Station D 107 Tmn 10.6 9.8 9.7 Tmx 17.6 16.8 17.1 AND 8 QUESTION 9 WIND CHILL INDEX (10) a) State the general limitations valid for both old and new WCI formulas. (5) b) Use the data supplied in Table 9.1 in order to calculate the new WCI for Cradock for each time step. (5) Table 9.1 Weather data for Cradock for 2007-05-16 Time Tdrybulb Twetbulb Wind Wind WCI h ºC ºC km/h m/s ºC 04:00 -2 -8 18 5.0 06:00 -4 -7 18 5.0 08:00 1 -8 22 6.2 10:00 6 -8 35 9.8 12:00 10 -9 45 12.6 OR QUESTION 10 FIRE DANGER INDEX (10) a) Make use of the attached nomogram and the data supplied in Table 10.1 in order to calculate the expected Lowveld Fire Danger Index (FDI) for Phalaborwa. (3) Table 10.1 Tomorrow’s weather forecast for Phalaborwa Parameter Tmx Tmn RHmx RHmn Rain Wind Unit ºC ºC % % mm km/h Forecast value 37 18 56 28 0 26 NOTE: The last rainfall in Phalaborwa was 18 mm and occurred 4 days ago. b) The following cut-off values are employed in the Lowveld Fire Danger Index: 0 - 20: Blue 21 – 45: Green 46 – 60: Yellow 61 – 75: Orange ≥ 76: Red State which fire danger rating you would allocate to Phalaborwa for tomorrow and discuss the expected fire behaviour and recommended fire control measures which apply. (7) AND 9 QUESTION 11 HEAT UNITS (10) Calculate both germination and emergence dates for lentils planted at a location in South Africa on 4 August. Base temperature for lentils is 1.4 oC; thermal time (TT) for germination is 30 and TT for emergence is 90. Table 11.1 Maximum (Tmx) and minimum (Tmn) temperatures for a location in South Africa where lentils were planted in 2005 Doy 212 213 214 215 216 217 218 219 220 221 222 223 224 Date 31-Jul-05 Tmx 18.2 21.7 21.9 20.4 19.7 20.4 19.5 21.0 22.8 22.8 19.0 20.0 23.3 Tmn 1.5 -0.1 0.8 0.4 0.2 0.4 1.5 2.8 11.9 5.5 1.5 2.6 3.5 TT STT OR QUESTION 12 DISCOMFORT INDEX (10) You are an agrometeorological expert and a private company approaches you for advice concerning the purchase of air-conditioning equipment for their offices in two different locations. They need to decide which location most urgently needs air conditioning as they are on a limited budget. Refer to Tables 12.1 and 12.2 and use the data given to a) Calculate the discomfort index (DI) for both locations for Dec and Jan. (6) b) Which location most urgently needs air-conditioning? Motivate. (4) Table 12.1 Climate data for location X Jan Feb Mar Apr May Jun Jul Aug Sep Oct Nov Dec C 24.30 25.90 24.90 22.20 19.40 17.20 16.40 16.60 18.30 20.30 22.60 24.30 % 25.80 26.70 25.20 22.10 19.90 17.10 16.00 16.80 18.70 20.70 22.00 23.90 83 80 73 67 61 59 60 64 69 74 LOCATION X Tmx RHmn DI o 10 Table 12.2 Climate data for location Y Jan Feb Mar Apr May Jun Jul Aug Sep Oct Nov Dec C 32.10 31.70 30.70 29.30 27.30 25.10 25.00 26.10 28.40 29.10 30.00 31.70 % 36.70 38.90 39.30 35.40 32.00 28.40 28.60 29.20 30.80 32.80 35.40 35.90 100 97 93 87 81 81 84 90 92 95 LOCATION Y Tmx RHmn DI o ________________________________________________________________ AND QUESTION 13 SEASONAL FORECASTING (10) Your farm is near Bethal in Mpumalanga highveld. It is after Christmas 2002 and little rain has fallen since the winter months. You receive the seasonal forecast in the map below from the South African Weather Service. Explain it to your neighbour. Describe some of the activities that you could use on your farm during 2003. Be sure to include practices connected with the water and land conservation and crop management. OR QUESTION 14 SHORT TERM FORECASTING (10) You are appointed as an agricultural consultant and one of your clients farm with lettuce in the central Free State. Study the short-term forecast (Table 14.1) and attached synoptic weather chart before answering the following questions: a) Describe the weather that is expected over the particular area and explain the problems that it may have in store for the specific farming activity. (2) b) Identify and describe the weather system(s) responsible for the weather described in (a). (4) c) Discuss the possible management decisions that can be made in order to alleviate the negative impacts of the weather or to make optimal use thereof (whatever the case may be). (4) 11 Discussion Issued on 1994-04-23 Dry air is in circulation over the interior with associated fine weather. A cold front causes strong winds and cloudy conditions with rain along the Cape south coast, which will spread eastwards to KwaZulu-Natal. A strong Atlantic Ocean High (AOH) of about 1032 hPa is ridging behind the cold front, which should force it northwards across the country. The AOH will ridge to the south of the country on the 24 th with strong onshore flow over the south and east coast where cloudy conditions with rain are forecast. The cold front will lie over the Northern Free State, Southern Mpumalanga and Swaziland with cold conditions to the south of it. Bergwind conditions are expected along the west coast due to a strong offshore flow. A cut-off low is developing off the west coast on the 25th, but will only cause some high level cloud over the coast and adjacent interior at this stage. The cold front will move out to the east of the country, while the onshore flow and cloudy conditions along the east coast will spread to the Lowveld. Fine but cool weather are expected over the remainder of the country. With the high southeast of the country on the 26th, partly cloudy conditions are expected to continue over the north-eastern parts of the country due to the influx of moist air around the periphery of the high. Fine weather are expected over the remainder of the country, except over the Western and South-western Cape where the cut-off low will cause an onshore flow with cloudy conditions and light showers. The cut-off low will move to the south of the country on the 27 th with a cold front approaching the country from the west. Cloudy conditions with rain are expected in the strong onshore flow along the south-west coast. The fine weather conditions are expected to continue over the rest of the country, with hot bergwinds in the offshore flow over the Eastern Cape coast to the east of the coastal low. 12 Table 14.1 5-Day Forecast for Bloemfontein (Free State) Date Cloud cover Weather Tmin Tmax Wind 1994-04-23 Fine Frost (am) 1 20 Moderate SW 1994-04-24 Partly cloudy nil 4 19 Moderate S to SE 1994-04-25 Fine Frost (am) -3 22 Light NE 1994-04-26 Fine Frost (am) -1 23 Light N to NE 1994-04-27 Partly cloudy Frost (am) 2 23 Moderate NW 13 FORMULA SHEET FORMULEBLAD p RT R 287 Jkg 1 K 1 E T 4 E T 4 1 2897 max T Rn S t r S t S e tSe Ld Le Lb 0 5.67 10 8 Wm 2 K 4 S aS rS tS vS St Sb S d va va' Ta Tw aC p 0.5 gm 3 K 1 0.066 kPaK 1 Lv e es Ta Tw 1 Atmosphere 1013.3 hPa C p 1010 Jkg 1 C 1 Lv 2.50 10 6 Jkg 1 e RH a 100 va' 100 es va es 0.6108 e 17.2694Tw 237.3Tw e A B SD es ea va' va VT Td 273.16 A 0.6108 e B 0.066Ta Tw 1 0.00115Tw ea 0.6108 ea 1 0.0579 ln 0.6108 273.16 2.0765 ln psy a psy P 17.2694Ta 237.3Ta ea e 0 Tw psy Ta Tw for ventilated Asmann type psychrometer apsy = 0.622×10⁻³ 900 u 2 es ea 0.408Rn G ET0 T 273 1 0.34u 2 1 0.34u 2 es at Ta Rn Rns Rnl All radiation parameters are in MJm-2d-1 Rns 1 0.23Rs 0.23 is the albedo for a well-watered short grass surface n Rs a s bs Ra where no calibrated values are available, a s 0.25 N bs 0.50 Rs 0 0.75 2 10 5 z Ra T K 4 Tmin K 4 Rs Rnl max 0.35 0.34 0.14 ea 1.35 2 Rs 0 ETc K c K s ET0 ET P I S SF CR R DP T Tmn TT mx Tb t 2 FDI BGI BI WF RCF RH mn DI OBI 2 Tmx Tmx 24 100 THI Tmx 0.36Td 41.2 old WCI nou WVI (0.2136 V 0.2637 0.0183V )(1.8T 59.4) 33 new WCI nuwe WVI 13.12 0.6215T 11.37 V 0.16 0.3965T V 0.16 14 15
