Assessment of Biostatistical Knowledge and Interpretation of Study
advertisement
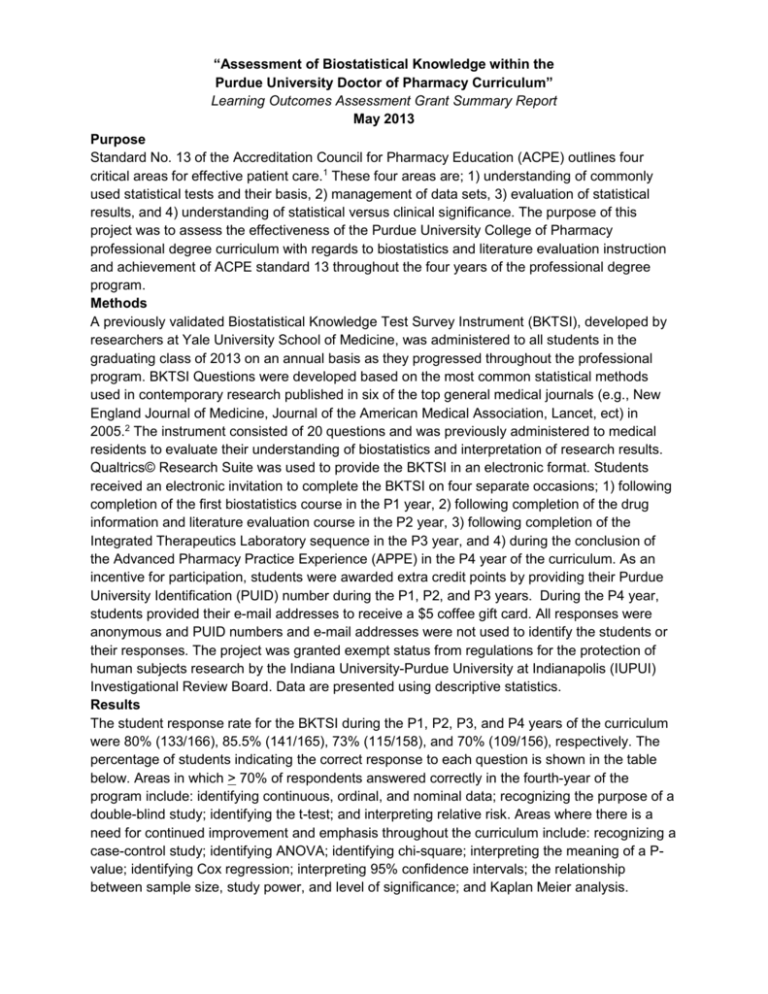
“Assessment of Biostatistical Knowledge within the Purdue University Doctor of Pharmacy Curriculum” Learning Outcomes Assessment Grant Summary Report May 2013 Purpose Standard No. 13 of the Accreditation Council for Pharmacy Education (ACPE) outlines four critical areas for effective patient care.1 These four areas are; 1) understanding of commonly used statistical tests and their basis, 2) management of data sets, 3) evaluation of statistical results, and 4) understanding of statistical versus clinical significance. The purpose of this project was to assess the effectiveness of the Purdue University College of Pharmacy professional degree curriculum with regards to biostatistics and literature evaluation instruction and achievement of ACPE standard 13 throughout the four years of the professional degree program. Methods A previously validated Biostatistical Knowledge Test Survey Instrument (BKTSI), developed by researchers at Yale University School of Medicine, was administered to all students in the graduating class of 2013 on an annual basis as they progressed throughout the professional program. BKTSI Questions were developed based on the most common statistical methods used in contemporary research published in six of the top general medical journals (e.g., New England Journal of Medicine, Journal of the American Medical Association, Lancet, ect) in 2005.2 The instrument consisted of 20 questions and was previously administered to medical residents to evaluate their understanding of biostatistics and interpretation of research results. Qualtrics© Research Suite was used to provide the BKTSI in an electronic format. Students received an electronic invitation to complete the BKTSI on four separate occasions; 1) following completion of the first biostatistics course in the P1 year, 2) following completion of the drug information and literature evaluation course in the P2 year, 3) following completion of the Integrated Therapeutics Laboratory sequence in the P3 year, and 4) during the conclusion of the Advanced Pharmacy Practice Experience (APPE) in the P4 year of the curriculum. As an incentive for participation, students were awarded extra credit points by providing their Purdue University Identification (PUID) number during the P1, P2, and P3 years. During the P4 year, students provided their e-mail addresses to receive a $5 coffee gift card. All responses were anonymous and PUID numbers and e-mail addresses were not used to identify the students or their responses. The project was granted exempt status from regulations for the protection of human subjects research by the Indiana University-Purdue University at Indianapolis (IUPUI) Investigational Review Board. Data are presented using descriptive statistics. Results The student response rate for the BKTSI during the P1, P2, P3, and P4 years of the curriculum were 80% (133/166), 85.5% (141/165), 73% (115/158), and 70% (109/156), respectively. The percentage of students indicating the correct response to each question is shown in the table below. Areas in which > 70% of respondents answered correctly in the fourth-year of the program include: identifying continuous, ordinal, and nominal data; recognizing the purpose of a double-blind study; identifying the t-test; and interpreting relative risk. Areas where there is a need for continued improvement and emphasis throughout the curriculum include: recognizing a case-control study; identifying ANOVA; identifying chi-square; interpreting the meaning of a Pvalue; identifying Cox regression; interpreting 95% confidence intervals; the relationship between sample size, study power, and level of significance; and Kaplan Meier analysis. BKTSI Question 1a. Identify continuous variable 1b. Identify ordinal variable 1c. Identify nominal variable 2. Recognize a case-control study 3. Recognize purpose of double-blind studies 4a. Identify ANOVA 4b. Identify chi-square analysis 4c. Identify t-test 5. Recognize definition of bias 6. Interpret the meaning of P value > 0.05 7. Identify Cox proportional hazard regression 8. Interpret standard deviation 9. Interpret 95% CI and statistical significance 10. Recognize power, sample size, and significance-level relationship 11. Determine which test has more specificity 12. Interpret odds ratio 13. Interpret odds ratio in multivariate regression analysis 14. Interpret relative risk 15. Determine strength of evidence for risk factors 16. Interpret Kaplan-Meier analysis results Class of 2013 P1 Year % correct (95% CI) N = 131 90.8% (85.9-95.8) 87.0% (81.3-92.8) 72.5% (64.9-80.2) 34.4% (26.2-42.5) 89.3% (84.0-94.6) 64.1% (55.9-72.3) 26.0% (18.4-33.5) 61.1% (52.7-69.4) 37.4% (29.1-45.7) 43.5% (35.0-52.0) 2.3% (0.0-4.9) 44.3% (35.8-52.8) 9.2% (4.2-14.1) 38.9% (30.6-47.3) Class of 2013 P2 Year % correct (95% CI) N = 141 95.2% (91.8-98.7) 78.8% (72.1-85.4) 74.7% (67.6-81.7) 15.1% (9.3-20.9) 89.0% (84.0-94.1) 67.1% (59.5-74.7) 37.7% (29.8-45.5) 61.0% (53.1-68.9) 19.9% (13.4-26.3) 53.4% (45.3-61.5) 52.1% (44.0-60.2) 52.1% (44.0-60.2) 16.4% (10.4-22.5) 49.3% (41.2-57.4) Class of 2013 P3 Year % correct (95% CI) N = 115 84.3% (76.5-89.9) 82.6% (74.5-88.5) 62.6% (53.4-70.9) 20% (13.7-28.3) 87.8% (80.5-92.7) 48.7% (39.7-57.7) 26% (18.8-34.8) 58.2% (49.1-66.8) 19.1% (12.9-27.3) 63.5% (54.3-71.7) 29.6% (21.9-38.4) 47.8% (38.9-56.8) 12.2% (7.2-19.5) 31.3% (23.5-40.2) Class of 2013 P4 Year % correct (95% CI) N = 109 83.4% (75.3- 89.3) 79.8% (71.2-86.3) 72.5% (63.4-80) 19.3% (12.8-27.7) 87.2% (79.4-92.3) 59.6% (50.2-68.3) 29.3% (21.6-38.5) 69.7% (60.5-77.5) 13.8% (8.4-21.6) 51.4% (42.1-60.6) 28.4% (20.8-37.6) 56.9% (47.5-65.8) 17.4% (11.3-25.7) 43.1% (34.2-52.5) 34.4% (26.2-42.5) 27.5% (19.8-35.1) 50.4% (41.8-58.9) 35.6% (28.9-43.4) 56.9% (48.8-64.9) 32.2% (24.6-39.8) 39.1% (30.6-48.2) 53% (43.9-61.9) 30.4% (22.7-39.3) 45.9% (36.8-55.2) 60.6% (51.2-69.2) 30.3% (22.4-39.5) 79.4% (72.5-86.3) 9.9% (4.8-15.0) 6.1% (2.0-10.2) 80.8% (74.4-87.2) 10.3% (5.4-15.2) 8.9% (4.3-13.5) 80% (71.7-86.3) 14.8% (9.3-22.5) 11.3% (6.6-18.5) 79.8% (71.3-86.3) 9.1% (4.9-16.2) 4.6% (1.7-10.6) Impact of the project: The results of this project have provided insight regarding the effectiveness of biostatistics and literature evaluation instruction throughout the PharmD Curriculum. With the implementation of the revised curriculum, several key concepts have been identified to target for quality improvement. In addition, the results underscore the importance of integrative learning. In general, the highest percentage of questions were answered correctly in the P1 year (following completion of the biostatatistics course) and in the P2 year (following completion of the drug information and drug literature evaluation course). The percentage of correct responses either decreased or were maintained throughout the P3 and P4 years. Therefore, continued exposure to these topics throughout the curriculum is necessary to continue to build on knowledge. It should be noted that when comparing the results of this project to the previously published data from medical residents, student pharmacists in the P4 year outperformed medical residents on greater than 50% of the questions. Limitations to this project include the lack of incentive to supply correct answers (versus any answer to gain extra credit points or a coffee gift card), the timing of the survey during the week before, and week of, final exams, and the ability for students to potentially work together on the test. Future Plans With the implementation of the revised professional degree curriculum, a three-credit course (PHRM 84800—Principles of Drug Information and Literature Evaluation) will be implemented during the P2 year of the curriculum (Fall 2013). This course will retain much of the same foundational material from the previous curriculum, but with additional emphasis on the interpretation of biostatistical methods and the practical implications of primary medical literature through the use of small group case discussions. Four recently published clinical trials will be reviewed and discussed throughout the semester to illustrate contemporary issues in the interpretation of biomedical research. Additional focus will be place on the topics identified through the results of this project. Continued emphasis of these concepts will be reinforced throughout the curriculum through activities in the longitudinal professional practice skills laboratories. Finally, we plan to continue to assess the effectiveness of our curriculum and to share the share the results of this project with our colleagues on a national level. References 1. Accreditation Standards and Guidelines for the Professional Program in Pharmacy Leading to the Doctor of Pharmacy Degree. Accreditation of Council for Pharmacy Education (ACPE). Available at https://www.acpe-accredit.org Accessed May 20, 2013. 2. Windish DM, Huot SJ, Green ML. Medicine residents’ understanding of the biostatistics and results in the medical literature. JAMA 2007;298:1010-22. Investigators: Amy Heck Sheehan, PharmD Associate Professor of Pharmacy Practice Purdue University College of Pharmacy Kevin Sowinski, PharmD, FCCP Professor of Pharmacy Practice Purdue University College of Pharmacy Lindsay E. Davison, PharmD Consumer Safety Officer Division of Drug Information, US Food and Drug Administration (FDA)
