Certificate of Calibration Slebe Twin RSM
advertisement
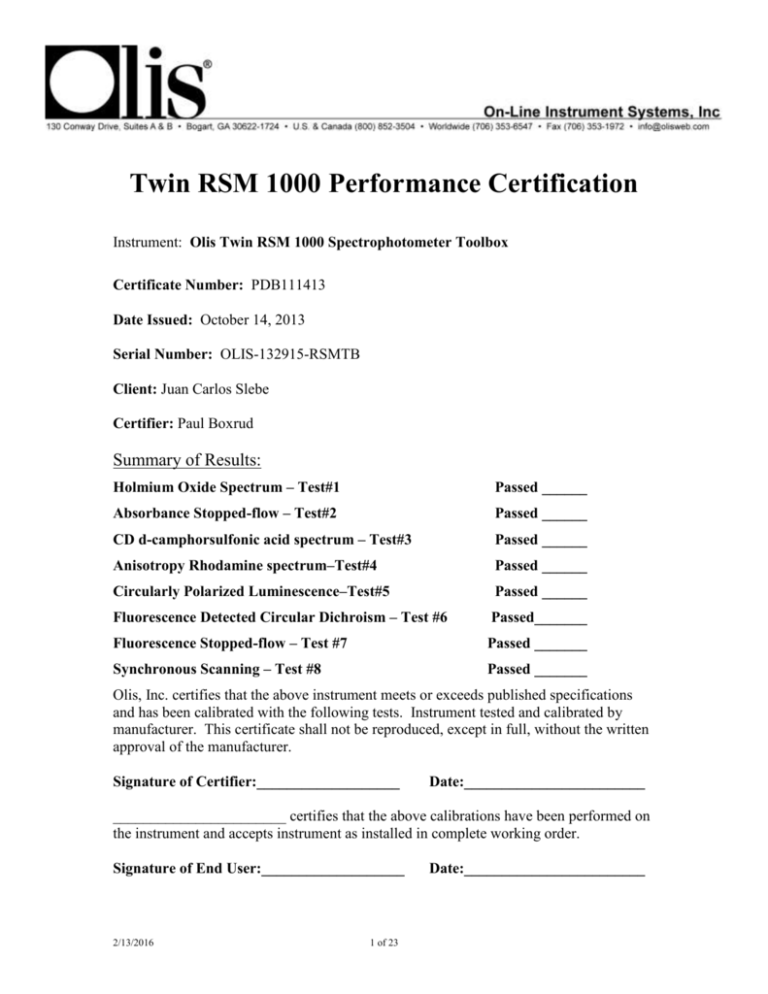
Twin RSM 1000 Performance Certification Instrument: Olis Twin RSM 1000 Spectrophotometer Toolbox Certificate Number: PDB111413 Date Issued: October 14, 2013 Serial Number: OLIS-132915-RSMTB Client: Juan Carlos Slebe Certifier: Paul Boxrud Summary of Results: Holmium Oxide Spectrum – Test#1 Passed ______ Absorbance Stopped-flow – Test#2 Passed ______ CD d-camphorsulfonic acid spectrum – Test#3 Passed ______ Anisotropy Rhodamine spectrum–Test#4 Passed ______ Circularly Polarized Luminescence–Test#5 Passed ______ Fluorescence Detected Circular Dichroism – Test #6 Passed_______ Fluorescence Stopped-flow – Test #7 Passed _______ Synchronous Scanning – Test #8 Passed _______ Olis, Inc. certifies that the above instrument meets or exceeds published specifications and has been calibrated with the following tests. Instrument tested and calibrated by manufacturer. This certificate shall not be reproduced, except in full, without the written approval of the manufacturer. Signature of Certifier:___________________ Date:________________________ _______________________ certifies that the above calibrations have been performed on the instrument and accepts instrument as installed in complete working order. Signature of End User:___________________ 2/13/2016 1 of 23 Date:________________________ Test #1: Wavelength calibration Absorbance spectrum of holmium oxide standard with conventional or rapid scanning. Conventional Scan Protocol: Configure the instrument to measure Conventional absorbance (Configuration #1A). Open the “Absorbance” instrument in the software. Set the wavelength range to cover the 400 nm to 500 nm range. Set the integration time to 0.2 sec. Enter 470 nm as the Current Wavelength. Click on Live Mode and set the PMT HV to give raw signal values (Sam and Ref) between 8 and 9 V). Collect a spectrum by clicking on Collect Data. Right-click on the dataset and choose Assign Baseline from the right-click menu. Place the holmium oxide sample in the cuvette holder. Begin the scan by clicking Collect Data. Rapid Scanning Protocol: Configure the instrument to measure Rapid scanning absorbance (Configuration #1B). Open the “RSM 1000 Stopped-flow Absorbance” instrument in the software. Set the Center Wavelength to 450 nm. Set the Collection Time to 1.0 second and the averaging mode to 1000 scans per second. With an empty cuvette holder, click on the Apply Baseline check box. Place the holmium oxide sample in the cuvette holder. Click on Collect Data. Click on the dataset, then right-click on the icon in the Experiment Window. Choose Select from the right-click menu. Right-click again and choose Average Scans Within Dataset. Absorbance 2.0 1.6 1.2 0.8 0.4 0.0 400 420 440 460 480 Wavelength, nm Expected and Measured results: 2/13/2016 Peak Expected peak position (nm) 1 418.7 2 of 23 Measured peak position (nm) 500 2 445.3 3 453.2 4 460.0 Comments: ________________________________________________ 2/13/2016 3 of 23 Test #2: Absorbance Stopped-Flow Measure the change in absorbance of the reduction of dichloroindolephenol (DCIP) with ascorbate. Single Wavelength Protocol: Configure the instrument for single wavelength stoppedflow (Configuration #2A). Open the “RSM 1000 Stopped-flow Absorbance” instrument in the software. Prepare a 100 uM solution of DCIP in pH 7 buffer. Prepare a solution of 1 mM sodium ascorbate in pH 7 buffer (+/1 pH unit is ok). Click on the Pretrigger checkbox to select the pre-trigger data. Add DCIP and the 1 mM ascorbate to the stopped-flow. Set the Current Wavelength to 600 nm. Set the Collection Time to 1.0 second. Fire a few stopped-flow shots to flush the tubing. Click on Collect Data to fire the stopped flow. Rapid Scanning Protocol: Configure the instrument for rapid scanning stopped-flow (Configuration #2B). Use the RSM 1000 Stopped-flow Absorbance” instrument in the software. Use the above DCIP and ascorbate solutions for the rapid scanning measurement. Set the Center wavelength to 600 nm and the averaging mode to 1000 scans per second. Click on the Assign Baseline check box to collect a baseline. Click Collect Data to fire the stopped-flow. 2/13/2016 4 of 23 Test #3: Circular dichroism Spectrum of 320-250 nm collected in a 1 mm pathlength cuvette containing a sample of 1.0 mg/mL d-camphorsulfonic (dCSA) acid dissolved in water. Protocol: Configure the instrument for circular dichroism (Configuration #3). Open the “Circular Dichroism” instrument in the software. Prepare a solution of 1.0 mg/mL dCSA (Aldrich catalog # C2107) in water. Check concentration by absorbance at 285 nm (1% at 285 nm=1.49). Place sample in a 1 mm pathlength cuvette. From the Live Display screen, change the Scan Range to 320 nm to 250 nm, the Integration Time to 0.5 sec, and the Number of Intervals to 70. With an empty chamber, click on Collect Data to collect a baseline. After the scan has finished, click on the data and then right-click again. Choose Apply Baseline from the pop-up menu. Insert the sample into the sample chamber and click on Collect Data. Expected result: CD intensity at 290.5 nm = between 31 and 34 millidegrees Actual result: ________________________________________________ Comments: ________________________________________________ 2/13/2016 5 of 23 Test #4: Anisotropy of Rhodamine acrylic block or Rhodamine/glycerol solution Fluorescence anisotropy excitation spectrum of Rhodamine acrylic block or Rhodamine glycerol solution Protocol: Configure the instrument for fluorescence anisotropy (Configuration #4). Open the “gPC 74” instrument in the software Place a Rhodamine acrylic block in the cuvette holder. Set the emission wavelength (Mono B) to 575 nm. Set the excitation (Mono A) scan range 350 nm to 550 nm. Set the Integration Time to 1 sec. Click Collect Data to start the spectrum. Expected result: Excitation spectrum dips below 0 at low wavelengths and plateaus at around 0.3 (0.34 for Rhodamine/glycerol) above 500 nm. Actual result: ________________________________________________ Comments: ________________________________________________ 2/13/2016 6 of 23 Test #5: Circularly Polarized Luminescence (CPL) CPL Spectrum Eu(facam)3 in DMSO Protocol: Configure the instrument for CPL (Configuration #5). Open the Circularly Polarized Luminescence instrument in the software. Place a cuvette containing Eu(facam)3 in DMSO. Set the excitation wavelength (Mono A) to 385 nm and the emission scan range (Mono B) to 550 nm to 620 nm. Set the Integration Time to 2.0 seconds. Click Collect Data to start the scan. Expected result: Minimum peak at 595 nm of approximately -0.77. Actual result: ________________________________________________ Comments: ________________________________________________ 2/13/2016 7 of 23 Test #6: Fluorescence Detected Circular Dichroism (FDCD) FDCD Spectrum of d-camphorsulfonic acid (dCSA) Protocol: Configure the instrument for CPL (Configuration #6). Open the “Fluorescence Detected Circular Dichroism” instrument in the software. Prepare a 1 mg/mL dCSA solution in water. Place a cuvette containing the CSA in the sample holder of the instrument. Set the excitation wavelength scan range (Mono A) to 250 nm to 350 nm nm and the emission wavelength to 427 nm. The Integration Time is set to 2 seconds. Ensure the emission filter in the PMT is appropriate for the measurement (e.g. high pass 400 nm) Expected result: Peak at 290 nm excitation. Actual result: ________________________________________________ Comments: ________________________________________________ 2/13/2016 8 of 23 Test #7: Fluorescence Stopped-flow Single wavelength and rapid scanning fluorescence stopped-flow Single Wavelength Protocol: Configure the instrument for stopped-flow fluorescence (Configuration #7A). Open the “RSM 1000 Stopped-flow Fluorescence” in the software. Prepare a 500 µM N-acetyl-tryptophanimide (NATA) and 800 µM N-bromosuccinimide in pH 7 buffer. Set the excitation wavelength (Mono A) to 290 nm and the emission to 350 nm. Fill one of the stopped-flow syringes with NATA and fill the other syringe with buffer. Push a few shots of NATA to flush the tubing. Set the PMT HV to a value to give a fluorescence signal of over 1 V. Expected result: Minimum peak at 595 nm of approximately -0.77. Actual result: ________________________________________________ Comments: ________________________________________________ 2/13/2016 9 of 23 Test #8: Synchronous Scanning Scatter spectrum of scattering sample Protocol: Configure the instrument to measure synchronous rapid scanning (Configuration #8). Open the “Scatter” instrument in the software. Place a scattering sample (or mirror) in the sample position. Set the Center Wavelengths of each monochromator to 450 nm. Note that if fluorescence is to be measured, the Mono B center wavelength should be set higher than the Mono A center wavelength. Set the Average Mode to 1 scan per second and adjust the PMT HV to give a signal of > 0.5 V if possible. Note the two possible positions for the PMT. Set the Collection time to 10 seconds. Click Collect Data to begin the scan. After data collection, right-click on the icon in the Experiment Window. Choose ‘select’ and right-click again. Choose Average Scans within the Dataset. Expected result: Scatter spectrum Actual result: ________________________________________________ Comments: ________________________________________________ 2/13/2016 10 of 23 Additional Information for Circular Dichroism Calibration d-Camphorsulfonic acid1 F.W. = 232.3 g/mol = 2.36 @ 290.5 nm for circular dichroism = 34.5 @ 285 nm for absorbance CD/Abs = 33/ = 2.26 1 mg/mL in 5 cm pathlength = 0.743 AU d-Camphorsulfonic acid2 = 2.37 @ 290.5 nm for circular dichroism = 34.5 @ 285 nm for absorbance CD/Abs = 33/ = 2.27 Pantolactone2 F.W. = 130.1 g/mol = -4.90 @ 220 nm ~90 @ 215 nm CD/Abs = 33/ = -1.77 1 Johnson C. W. (1996) in Circular Dichroism and the Conformational Analysis of Biomolecules. Fasman, G. D. Ed. Plenum Press, New York, pp. 635-652. 2 Schippers, P. H. and Dekkers, H. P. J. M. (1981) Anal. Chem. 53, 778. 2/13/2016 11 of 23 Configuration 1A (Single Wavelength Absorbance): Entrance Slit (0.6 mm) 150 W xenon lamp (ozone) Emission RSM Mono B (not used) Beam splitter PEM, not used RSM (400 lines per mm blazed at 500 nm; Mono A) Sam PMT Fixed Slit Cartridge (0.12 mm) Four cell turret Reference PMT Exit slit (0.12 mm) Instrument: Absorbance Data Reduction Mode: Absorbance Data Collection Mode: Scan Scan Mode: Fixed Slitwidth and PMT HV 2/13/2016 12 of 23 Configuration 1B (Rapid Scanning Absorbance): Entrance slit (0.6 mm) 150 W xenon lamp (ozone) Emission RSM Mono B (not used) Beam splitter PEM, not used RSM (400 lines per mm, blazed at 500 nm; Mono A) Sam PMT ScanDisk (0.2 mm) Four cell turret Exit slit (0.12 mm) Instrument: RSM 1000 Stopped-flow Absorbance Data Reduction Mode: Absorbance Data Collection Mode: Rapid Scanning Scan Mode: Fixed Slitwidth and PMT HV 2/13/2016 13 of 23 Reference PMT Configuration 2A (Stopped-flow Absorbance, single wavelength): Emission RSM (not used) Entrance slit (0.6 mm) Beam splitter 150 W xenon lamp (ozone) PEM, not used RSM (blazed at 500 nm) Sam PMT Fixed Slit Cartridge (0.12 mm) Stoppedflow cell Reference PMT Exit slit (0.12 mm) Instrument: RSM 1000 Stopped-flow Absorbance Data Reduction Mode: Absorbance Data Collection Mode: Stopped-flow Scan Mode: Fixed Slitwidth and PMT HV 2/13/2016 14 of 23 4 x 4 mm stopped-flow (replaces sample holder) Configuration 2B (Stopped-flow absorbance, rapid scanning): Entrance slit (0.6 mm) 150 W xenon lamp (ozone) Emission RSM (not used) Beam splitter PEM, not used RSM (blazed at 500 nm) Sam PMT ScanDisk (0.2 mm) Stoppedflow cell Reference PMT Exit slit (0.12 mm) Instrument: RSM 1000 Stopped-flow Absorbance Data Reduction Mode: Absorbance Data Collection Mode: Rapid Scanning + SF Scan Mode: Fixed Slitwidth and PMT HV 2/13/2016 15 of 23 4 x 4 mm stopped-flow (replaces sample holder) Configuration 3 (Circular Dichroism scan): Entrance slit (1.24 mm) 150 W xenon lamp (ozone) Emission RSM B (not used) RSM (2400 line blazed at 250 nm; Mono A) CD PMT Fixed ScanDisk (1.24 mm) Four cell turret CD polarizer PEM MgF2 Exit slit (1.24 mm) Instrument: Circular Dichroism Data Reduction Mode: Circular Dichroism Data Collection Mode: Scan Scan Mode: Fixed Slitwidth 2/13/2016 16 of 23 Configuration 4 (Anisotropy/Polarization): Entrance slit (0.6 mm) Fixed Scan Cartridge (0.6 mm) Entrance slit 0.6 mm) PEM 150 W xenon lamp (ozone) Emission RSM (400 lines per mm, 500 nm Mono B) Emission polarizer, Horizontal RSM (400 lines per mm, 500 nm, Mono A) Unused PMT Fixed Scan Cartridge (0.6 mm) Four cell turret Exit slit (0.6 mm) Instrument: gPC 74 Data Reduction Mode: Polarization 74 Data Collection Mode: Scan Scan Mode: Fixed Slitwidth and PMT HV 2/13/2016 Photon counter 17 of 23 Excitation polarizer, Vertical Configuration 5 (Circularly Polarized Luminescence): Entrance slit (1.24 mm) Fixed Scan Cartridge (1.24 mm) Emission RSM (400 line, 500 nm, Mono B) Photon counter PEM 150 W xenon lamp (ozone) Emission polarizer, horizontal RSM (400 lines per mm, blazed at 500 nm, Mono A) Unused PMT Fixed Scan Cartridge (1.24 mm) Four cell turret Exit slit (1.24 mm) Instrument: Circularly Polarized Luminescence Data Reduction Mode: CPL Data Collection Mode: Scan Scan Mode: Fixed Slitwidth and PMT HV 2/13/2016 18 of 23 Configuration 6 (Fluorescence Detected Circular Dichroism): Entrance slit (1.24 mm) 150 W xenon lamp (ozone) Fixed Slit Cartridge (3.32 mm) Unused CD PMT RSM (2400 line, blazed at 250 nm; Mono A) Fixed Scan Cartridge (1.24 mm) Four cell turret CD polarizer PEM MgF2 Exit slit (0.6 mm) Instrument: Fluorescence Detected Circular Dichroism Data Reduction Mode: FDCD Data Collection Mode: Scan Scan Mode: Fixed Slitwidth and PMT HV 2/13/2016 Photon counting module Emission RSM B 19 of 23 Configuration 7A (Fluorescence Stopped-flow, single wavelength): Entrance slit (0.6 mm) Fixed Scan Cartridge (0.6 mm) Emission RSM (400 line, 500 nm blaze, Mono B) PMT 150 W xenon lamp (ozone) RSM (Mono A) Unused CD PMT Fixed ScanDisk (0.6 mm) Stoppedflow cell Unused PEM positions Exit slit (0.6 mm) Instrument: RSM 1000 Stopped-flow Fluorescence Data Reduction Mode: Fluorescence Data Collection Mode: Stopped-flow Scan Mode: Fixed Slitwidth and PMT HV 2/13/2016 20 of 23 4 x 4 mm stopped-flow (replaces sample holder) Configuration 7B (Fluorescence stopped flow, rapid scanning): 1 .0 mm ScanDisk Emission RSM (400 line, 500 nm blaze, Mono B) Entrance slit (0.6 mm) PMT 150 W xenon lamp (ozone) RSM (Mono A) Unused CD PMT Fixed ScanDisk (0.6 mm) Stoppedflow cell Unused PEM positions Exit slit (0.6 mm) Instrument: RSM 1000 Stopped-flow Fluorescence Data Reduction Mode: Fluorescence Data Collection Mode: Rapid Scanning + SF Scan Mode: Fixed Slitwidth and PMT HV 2/13/2016 21 of 23 4 x 4 mm stopped-flow (replaces sample holder) Configuration 8 (Synchronous scanning): PMT optional position Synchronous Scanning Configuration: Entrance slit (1.24 nm) 150 W xenon lamp (ozone) StepDisk (1.0 mm) Emission RSM (Mono B) Exit slit (1.24 mm) Entrance slit (1.24 nm) PMT, optional position RSM (400 line, 500 nm Mono A) PMT not used StepDisk (1.0 mm) Four cell turret PEM (not used) Exit slit (1.24 mm) Instrument: Scatter Data Reduction Mode: Fluorescence Data Collection Mode: Rapid Scanning Scan Mode: Fixed Slitwidth and PMT HV 2/13/2016 22 of 23 2/13/2016 23 of 23
