Supplemental Results
advertisement
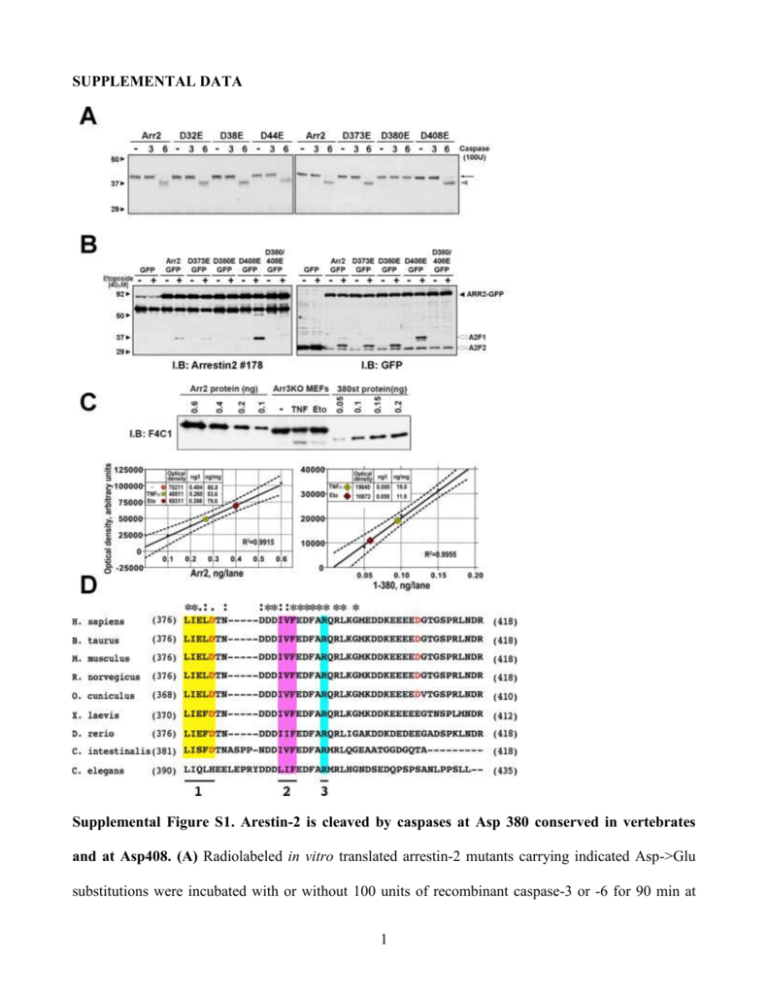
SUPPLEMENTAL DATA Supplemental Figure S1. Arestin-2 is cleaved by caspases at Asp 380 conserved in vertebrates and at Asp408. (A) Radiolabeled in vitro translated arrestin-2 mutants carrying indicated Asp->Glu substitutions were incubated with or without 100 units of recombinant caspase-3 or -6 for 90 min at 1 30ºC and analyzed by SDS-PAGE followed by autoradiography. The elimination of potential sites in the N-domain by D32E, D38E, and D44E mutations did not affect caspase cleavage, as evidenced by the presence of the cleavage fragment (grey arrowhead) running faster than full-length arrestin-2 (black arrow). Among putative C-terminal sites, the substitution of D380 with glutamate blocked the generation of ~47 kDa arrestin-2 fragment corresponding to arrestin-2-(1-380) (1-380; arrowhead). (B) To detect small C-terminal fragments, we used arrestin-2 fusion with C-terminal GFP. Rat-1 cells expressing wild type (WT) arrestin-2-GFP or indicated mutants were incubated without (-) or with (+) etoposide for 18 h. Cell lysates were analyzed with anti-arrestin-2 (left panel) and anti-GFP (right panel) antibodies. Two GFP-immunoreactive fragments, A2F1 and A2F2, originating from the Cterminus were generated from full-length arrestin2-GFP (black arrowhead). Three potential cleavage sites (TPVD373T, IELD380T, and EEED408G) compatible with the fragment’s sizes were eliminated by D373E, D380E, or D408E mutations. Arrrestin-2-GFP and arrestin-2-D373E-GFP yielded the same two fragments (A2F1 and A2F2). Mutations D380E and D408E abrogated the generation of the larger (A2F1) and smaller (A2F2) fragments, respectively. Arrestin-2-D380E,D408E (DblE)-GFP was resistant to caspase cleavage. Thus, Asp380 and Asp408 are selectively cleaved by caspases. Like most caspase targets, these residues are localized in the arrestin-2 element without rigid secondary structure (1). (C) Quantification of full-length arrestin-2 and 1-380 cleavage fragment generated in A3KO MEFs following treatment with TNFCHX for 9 h (TNF) or etoposide for 24 h (Eto). Known amounts of purified arrestin-2 and 1-380 were loaded on the gel alongside the samples as standards to construct calibration curves. The upper panel shows a typical blot with the amount of arrestin-2 and 1-380 standards indicated (ng per lane). The lower panel shows the linear regression fit of the calibration curves with 95% confidence intervals for full-length arrestin-2 (left graph) and 1-380 (right graph), with R squared indicated. The samples are shown on the curves as color-coded symbols. The table on each graph shows the conversion of optical density to absolute amounts of arrestin proteins expressed 2 in ng per lane and in ng per mg of total protein (5 g of total protein was loaded per lane). The calculations show that approximately 26% or 13% of arrestin-2 is cleaved upon TNF or Eto treatment, respectively, yielding 90 nM and 55 nM intracellular concentration (based on ~20% (w/v) protein content of the cell) (D) Sequence alignment of the C-termini of cloned vertebrate arrestin-2, and the only arrestins expressed in proto-chordate ascidian Ciona intestinalis and nematode Caenorhabditis elegans. Conserved Asp380 in most vertebrates (Asp372 in rabbit, Asp374 in frog) and homologous Asp385 in C. intestinalis are shown in bold red. Note that the cleavage site in the position homologous to Asp380 is not conserved in C. elegans. Also note that the second cleavage site (Asp408 in human arrestin, bold red) is conserved in mammals, but not in other vertebrates and the ascidian. Other highly homologous elements with known functions are indicated, as follows: 1 (highlighted yellow), main clathrin-binding site; 2 (magenta), three hydrophobic residues that anchor the arrestin C-tail to the body of the N-domain; 3 (blue), Arg382 is the part of the “polar core” that functions as the main phosphate sensor in arrestins. residues; * above the alignment indicate conserved single : indicates conserved "strong" groups such as hydrophobic residues; . indicates conserved "weak" groups of residues. Sequence accession numbers are: Bos taurus (cattle), NP_776668; Homo sapiens (human), NP_004032; Mus musculus (mouse), NP_796205; Oryctolagus cuniculus (rabbit), AAC48753: Rattus norvegicus (rat), NP_037042; Xenopus laevis (African clawed frog), NM_001094402.1; Danio rerio (zebrafish), NM_0011598822.1; Ciona intestinalis (sea squirt), BAB60819; Caenorhabditis elegans, U41023.1. 3 Supplemental Figure S2. Caspase-resistant arrestin-2-D380E,D408E does not affect the integrity of isolated mitochondria or cytochrome C release induced by caspase-cleaved Bid. (A) Isolated mouse liver mitochondria (20 g) were incubated in 50 l with or without 10 nM tBID and indicated concentrations of purified arrestin2-D380E,D408E (DblE) for 20 min at room temperature. Mitochondria were pelleted by centrifugation at 16,000xg for 10 min at 4°C. The distribution of cytochrome C, DblE, and COX-IV in the pellet and supernatant is shown. COX-IV serves as loading 4 control, as well as control of mitochondria integrity and completeness of mitochondria solubilization by Triton X-100. (B) The fraction of cytochrome C released by 10 nM tBID without (0 nM) or with DblE (50 and 100 nM) is shown as the percent of the total cytochrome C (released by Triton X-100). Means + S.E.M. of four independent experiments are shown. tBID induces the release of ~40% of cytochrome C, and caspase-resistant DblE does not affect cytochrome C release with (F(2,9)=0.56 p=0.59) or without tBID. (C) Biological activity of His6-tagged tBID. Isolated mouse liver mitochondria (20 g) were incubated without (Control) or with 10 nM tBID or purified Hig6-tagged tBID for 20 min at room temperature. Mitochondria were pelleted by centrifugation at 16,000xg for 10 min at 4°C. The amount of released cytochrome C in the supernatant is shown. Triton X-100 was added to release total cytochrome C (Total) in the sample. Supplemental Figure S3. Expression levels of the components of death pathway or pro- and antiapoptotic BCL proteins do not explain the resistance of DKO MEFs to TNF. Comparison of the levels of expression of proteins in the TNF pathway pro-apoptotic BH3 proteins and pro-survival BCL family members in A3KO and DKO MEFs was measured by Western blot. Left panels show representative blots. Bar graph shows quantification the protein expression levels from 3-4 5 independent experiments. ** - p<0.01; * - p<0.05 to A3KO MEFs according to repeated measures ANOVA with MEF type as the factor. Supplemental Figure S4. Flow cytometric analysis of A3KO and DKO MEFs positive for active caspase-3. (A) Caspase-3 activation in A3KO and DKO MEFs by TNFtreatment measured by flow 6 cytometry. A3KO and DKO MEFs were exposed to TNF/CHX for indicated time. Activated caspase3 was detected using BD Pharmingen active caspase-3 antibody and quantified by flow cytometry (2). Cell sorting was performed using LSRII flow cytometer (Becton Dickinson) by analyzing 10,000 events for cell viability. Cells were gated for analysis by a combination of forward scatter channel (FSC) and side scatter channel (SSC). Gating for the controls were exactly the same for all samples. The data are expressed as a percentage of cells positive for activated caspase-3. The data analysis was performed using Flowjo software. The results of a representative experiment (out of four performed) are shown. (B) Transfection efficiency of pCMS-EGFP (the fraction of green GFP-expressing cells) analyzed by flow cytometry. The transfection efficiency in A3KO (upper panel) or DKO (lower panel) MEFs, untransfected or transfected with pCMS-EGFP or pCMS-(1-380)-EGFP as indicated, was analyzed 48 h post-tranfection by flow cytometry by gating GFP-positive cells in averages of 10,000 cells that were gated by the combination of FSC and SSC. (C) Flow cytometric analysis of cells positive for active caspase-3 after transfection of A3KO MEFs with pCMS-EGFP or DKO MEFs with pCMS-EGFP, pCMS-arrestin-2-EGFP, pCMS-DblE-EGFP, or pCMS-(1-380)-EGFP. After transfection, cells were treated with THF/CHX for 0 h (control) or 10 h, and active caspase-3 was analyzed by flow cytometry (2). Cells were gated for analysis by a combination of FSC and SSC and GFP positive signal. The data are expressed as a percentage of 5,000 GFP-expressing cells positively stained for activated caspase-3. The data analysis was performed using Flowjo software. The results of a representative experiment (out of four performed) are shown. 7 8 Supplemental Figure S5. Retroviral constructs used to infect BID KO MEFS and gating strategy for GFP-positive BID KO MEFs by flow cytometry. (A) The IRES-EGFP cassette was subcloned into pFB retroviral vector (Stratagene) between EcoRI and NotI restriction sites to produce the control retroviral clone. The transcription was initiated from the viral promoter located within 5' long terminal repeat (5'LTR) sequence. Similarly, arrestin-2-(1-380)-IRES-EGFP cassette was inserted between EcoRI and NotI sites to produce the virus expressing arrestin-2-(1380) with co-cistronic expression of EGFP. To make the clone for the co-exprssion of BID and EGFP, SV40-BID cassette was inserted into the pFB-IRES-EGFP clone into the NotI site. Similarly, to produce the clone expressing all three proteins, SV40-BID cassette was inserted into the pFB-Arr2(1-380)-IRES-EGFP clone into the NotI site. Note that none of the proteins had any extraneous tags. (B) A typical experiment shows the gating strategy for the GFP-expressing BID KO MEFs. The forward scatter channel (FSC) intensity roughly equates to the particle’s size and can also be used to distinguish between cell debris and living cells. The side scatter channel (SSC) provides information about the granular content within a particle (Vermes et al., 2000). First, we created FSC Area (FSC-A) vs SSC Area (SSC-A) dot plot and selected region P1 to exclude debris or uninfected and unstained BID KO MEFs. Within P1 regions, we created SSC-H vs SSC-W dot plot and selected region P2. P2 regions that show only the SSC gated population were gated again with FSC-H vs FSC-W and region P3 that includes only intact and “viable” BID KO MEFs was selected. GFP signal from the uninfected and unstained Bid-/- MEFs within P3 region was detected and P4 region was selected as the population having GFP signal (not present in control cells that do not express GFP). Exactly the same gating was used for all samples. Note that the proportion of GFP-positive cells decreases with the number of proteins expressed. This is likely due to reduced expression of all proteins, including GFP, per cell when more than one exogenous protein is expressed. However, even among cells expressing all three proteins (GFP, Bid, and arrestin-2-(1-380)) the proportion of GFP-positive cell remains high enough for meaningful analysis. SUPPLEMENTAL REFERENCES 9 1. Han M, Gurevich VV, Vishnivetskiy SA, Sigler PB, Schubert C. Crystal structure of betaarrestin at 1.9 A: possible mechanism of receptor binding and membrane Translocation. Structure 2001; 9 (9): 869-880. 2. Vermes I, Haanen C, Reutelingsperger C. Flow cytometry of apoptotic cell death. J Immunol Methods 2000; 243: 167-190. 10
