MS-Word - International Olympiad in Informatics
advertisement
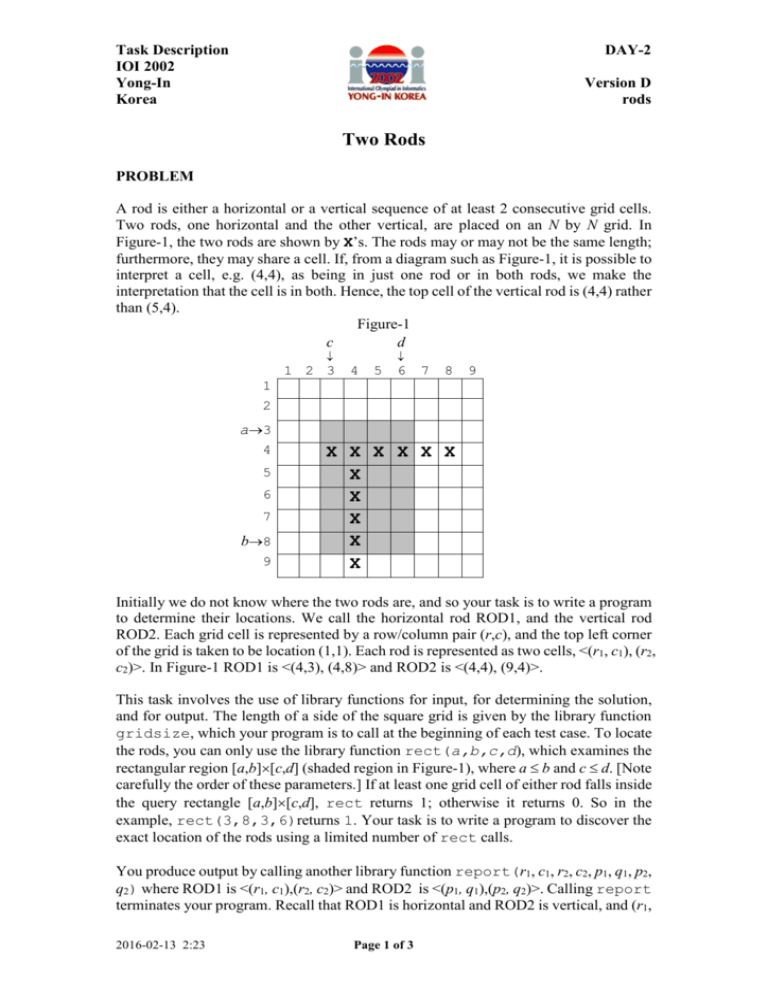
Task Description IOI 2002 Yong-In Korea DAY-2 Version D rods Two Rods PROBLEM A rod is either a horizontal or a vertical sequence of at least 2 consecutive grid cells. Two rods, one horizontal and the other vertical, are placed on an N by N grid. In Figure-1, the two rods are shown by X’s. The rods may or may not be the same length; furthermore, they may share a cell. If, from a diagram such as Figure-1, it is possible to interpret a cell, e.g. (4,4), as being in just one rod or in both rods, we make the interpretation that the cell is in both. Hence, the top cell of the vertical rod is (4,4) rather than (5,4). Figure-1 c d 1 2 3 4 5 6 7 8 9 1 2 a3 4 5 6 7 b8 9 X X X X X X X X X X X Initially we do not know where the two rods are, and so your task is to write a program to determine their locations. We call the horizontal rod ROD1, and the vertical rod ROD2. Each grid cell is represented by a row/column pair (r,c), and the top left corner of the grid is taken to be location (1,1). Each rod is represented as two cells, <(r1, c1), (r2, c2)>. In Figure-1 ROD1 is <(4,3), (4,8)> and ROD2 is <(4,4), (9,4)>. This task involves the use of library functions for input, for determining the solution, and for output. The length of a side of the square grid is given by the library function gridsize, which your program is to call at the beginning of each test case. To locate the rods, you can only use the library function rect(a,b,c,d), which examines the rectangular region [a,b][c,d] (shaded region in Figure-1), where a b and c d. [Note carefully the order of these parameters.] If at least one grid cell of either rod falls inside the query rectangle [a,b][c,d], rect returns 1; otherwise it returns 0. So in the example, rect(3,8,3,6)returns 1. Your task is to write a program to discover the exact location of the rods using a limited number of rect calls. You produce output by calling another library function report(r1, c1, r2, c2, p1, q1, p2, q2) where ROD1 is <(r1, c1),(r2, c2)> and ROD2 is <(p1, q1),(p2, q2)>. Calling report terminates your program. Recall that ROD1 is horizontal and ROD2 is vertical, and (r1, 2016-02-13 2:23 Page 1 of 3 Task Description DAY-2 IOI 2002 Yong-In Version D Korea rods c1) is the left end cell of the horizontal rod ROD1. Cell (p1, q1) is the top end cell of ROD2. Hence r1= r2, c1 < c2, p1 < p2, and q1= q2. If your report parameters do not meet these constraints, then you will get error messages on standard output. CONSTRAINTS You can access input only by using the library functions gridsize and rect. N, the maximum row (column) size of input, satisfies 5 N 10000. The number of rect calls should be at most 400 for every test case. If your program calls rect more than 400 times, this will terminate your program. Your program must call rect more than once and call report exactly once. If a rect call is not valid (e.g., the query range exceeds the grid space), it will terminate your program. Your program must not read or write any files and must not use any standard input/output. LIBRARY You are given a library in the following: FreePascal Library (prectlib.ppu, prectlib.o) function gridsize: LongInt; function rect(a,b,c,d : LongInt) : LongInt; procedure report(r1, c1, r2, c2, p1, q1, p2, q2 : LongInt); Instructions: To compile your rods.pas, include the import statement uses prectlib; in the source code and compile it as fpc –So –O2 –XS rods.pas The program prodstool.pas gives an example of using this FreePascal library. GNU C/C++ Library (crectlib.h, crectlib.o) int gridsize(); int rect(int a, int b, int c, int d); void report(int r1, int c1, int r2, int c2, int p1, int q1, int p2, int q2); Instructions: To compile your rods.c, use #include “crectlib.h” in the source code and compile it as: gcc –O2 –static rods.c crectlib.o –lm g++ –O2 –static rods.cpp crectlib.o –lm The program crodstool.c gives an example of using this GNU C/C++ library. 2016-02-13 2:23 Page 2 of 3 Task Description IOI 2002 Yong-In Korea DAY-2 Version D rods For C/C++ in the RHIDE environment Be sure that you set the Option->Linker configuration to crectlib.o . EXPERIMENTATION To experiment with the library, you must create a text file rods.in. The file must contain three lines. The first line contains one integer: N, the size of the grid. The second line contains the coordinates of ROD1, r1 c1 r2 c2; where (r1, c1) is the left end cell of ROD1. The third line contains the coordinates of ROD2, p1 q1 p2 q2, where (p1, q1) is the top end cell of ROD2. After running your program which calls report, you will get the output file rods.out. This file contains the number of rect function calls and the coordinates of the ends of the rods you submitted in your call to report. If there are any errors or violations of the requirements during library calls, then rods.out will contain the corresponding error messages. The dialogue between your program and the library is recorded in the file rods.log. This log file rods.log shows the sequence of function calls your program made in the form of “k : rect(a,b,c,d) = ans”, which means k-th function call rect(a,b,c,d) returns ans. EXAMPLE INPUT AND OUTPUT Example: rods.in rods.out 9 4 3 4 8 4 4 9 4 20 4 3 4 8 4 4 9 4 SCORING If your program violates any of the constraints (e.g., more than 400 rect calls), or if your program’s output (the locations of the rods) is not correct, the score is 0. If your program’s output is correct, then your score depends on the number of rect calls for each testing data. For each test case if the number of rect calls is at most 100, then you get 5 points. If your program calls rect 101 to 200 times, you get 3 points. If the number of rect calls is between 201 and 400, then you get 1 point. 2016-02-13 2:23 Page 3 of 3
