Evaluating Existing Annotations with GAEVAL
advertisement
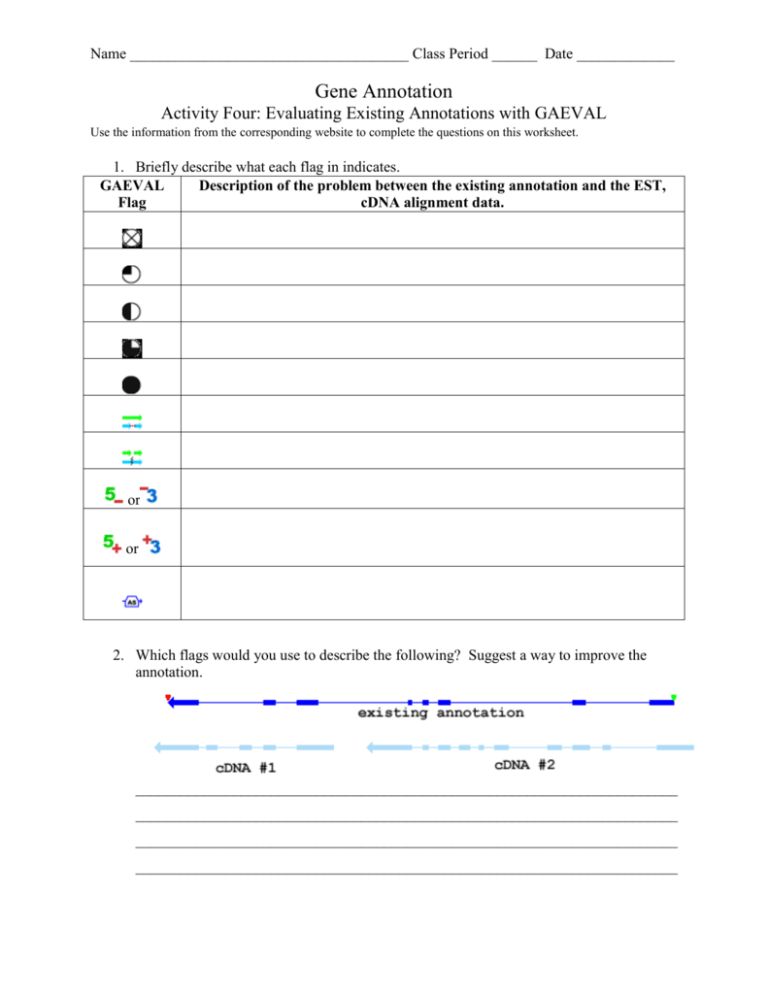
Name _____________________________________ Class Period ______ Date _____________ Gene Annotation Activity Four: Evaluating Existing Annotations with GAEVAL Use the information from the corresponding website to complete the questions on this worksheet. 1. Briefly describe what each flag in indicates. GAEVAL Description of the problem between the existing annotation and the EST, Flag cDNA alignment data. or or 2. Which flags would you use to describe the following? Suggest a way to improve the annotation. ________________________________________________________________________ ________________________________________________________________________ ________________________________________________________________________ ________________________________________________________________________ GAEVAL Flag Description of the problem between the existing annotation and the EST, cDNA alignment data. no known EST of cDNA have been assigned to a predicted gene by GeneSeqer expressed sequence exists in the region of the gene annotation, however no splice sites were confirmed at least one splice site is confirmed all splice sites are aligned, however there are some gaps in the coverage between splice sites all splice sites are aligned and also that the annotation is completely covered incorrectly split a single gene into multiple adjacent gene annotations or incorrectly merge multiple adjacent gene structures into a single gene annotation the 5’ or 3' end of the annotation does not have splice alignment support and should there fore be shortened to match the evidence or the 5' or 3’ end of the annotation should be extended (added) to reflect the cDNA evidence a second cDNA or EST contains a region that supports an alternative gene model with a different number of exons 2. There are several exons that are present in the cDNA that are not present in the existing annotation. Also there are two separate cDNA, suggesting two gene models (fission or the existing annotation) and both ends of the existing annotation need to be extended to match the cDNA evidence. 1. 2. 3. 4. 5. 6. 7. 8. The Evidence Plot and the Evidence Table The Evidence Plot The entire structure (all of the exons) are added to the (green) gene model First click and it is selected (not the other exons on the same structure) on the second click it is deselected. The coordinates of the exon correspond to nucleotide bases in the genome, basically defining where the exon starts and stops in the sequence a chromosome The Max Sim Score and the number of cDNA and EST structures that contain the exons in question A color block represents a groups of variants for the same exon, so only one should be selected for each gene model Exons
