Table S1 Pseudopod properties of Dictyostelium mutants in buffer
advertisement
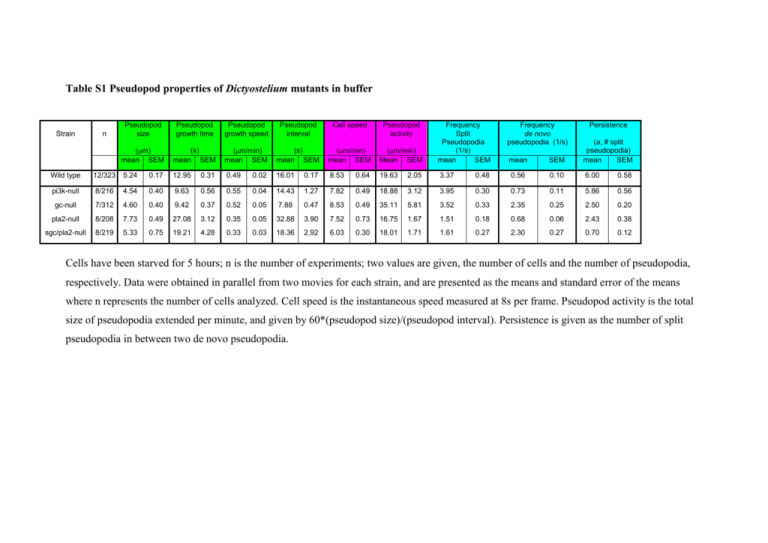
Table S1 Pseudopod properties of Dictyostelium mutants in buffer Strain n Pseudopod size Pseudopod growth time Pseudopod growth speed Pseudopod interval Cell speed Pseudopod activity (m) mean SEM (s) mean SEM (m/min) mean SEM (s) mean SEM (m/min) mean SEM (m/min) Mean SEM Frequency Split Pseudopodia (1/s) mean SEM Frequency de novo pseudopodia (1/s) Persistence mean SEM (a, # split pseudopodia) mean SEM Wild type 12/323 5.24 0.17 12.95 0.31 0.49 0.02 16.01 0.17 8.53 0.64 19.63 2.05 3.37 0.48 0.56 0.10 6.00 0.58 pi3k-null 8/216 4.54 0.40 9.63 0.56 0.55 0.04 14.43 1.27 7.82 0.49 18.88 3.12 3.95 0.30 0.73 0.11 5.86 0.56 gc-null 7/312 4.60 0.40 9.42 0.37 0.52 0.05 7.88 0.47 8.53 0.49 35.11 5.81 3.52 0.33 2.35 0.25 2.50 0.20 pla2-null 8/208 7.73 0.49 27.08 3.12 0.35 0.05 32.88 3.90 7.52 0.73 16.75 1.67 1.51 0.18 0.68 0.06 2.43 0.38 sgc/pla2-null 8/219 5.33 0.75 19.21 4.28 0.33 0.03 18.36 2.92 6.03 0.30 18.01 1.71 1.61 0.27 2.30 0.27 0.70 0.12 Cells have been starved for 5 hours; n is the number of experiments; two values are given, the number of cells and the number of pseudopodia, respectively. Data were obtained in parallel from two movies for each strain, and are presented as the means and standard error of the means where n represents the number of cells analyzed. Cell speed is the instantaneous speed measured at 8s per frame. Pseudopod activity is the total size of pseudopodia extended per minute, and given by 60*(pseudopod size)/(pseudopod interval). Persistence is given as the number of split pseudopodia in between two de novo pseudopodia.
