Quantitative Analysis of Pseudopod Formation
With the ImageStream Cell Imaging System
Poh C. Tan1, Kelly M. McNagny1, and Brian Hall2
1 The Biomedical Research Centre, 2222 Health Sciences Mall, University of British Columbia, Vancouver, B.C. V6T 1Z3
2 Amnis Corporation, 2505 3rd Avenue, Seattle, WA 98121 800.730.7147 www.amnis.com
Quantitative Analysis of Pseudopod Formation
Background and Technology
The ImageStream system for imaging cells in flow combines the
capabilities of microscopy and flow cytometry in a single platform,
allowing quantitative image-based cellular assays in large and heterogeneous cell populations. In the experiment presented here,
we used the capabilities of the ImageStream system to quantitate
changes in cell morphology during the process of pseudopod
formation in a cytokine-dependent cell line and to correlate the
morphological changes with the distribution of a marker protein.
Using only measurements of cell morphology we were able to
follow the process of pseudopod formation in the cell population
during recovery from cytokine deprivation. Adding measurements
of molecular distribution allowed us to create a comprehensive
classification scheme to separate three distinct cell types and identify one atypical cell group. These results offer one striking ex-
CANADA
ample of the unique power of analytical morphometry offered by
the ImageStream system.
The ImageStream system is operationally similar to a flow cytometer but it has the ability to generate six simultaneous images of
each cell at a rate of approximately 300 cells per second, with resolution similar to that of a fluorescence microscope. Each cell is represented by a brightfield image, a darkfield image and up to four
different fluorescence images. The ImageStream can thus be used
to provide quantitative information about not just the prevalence
of target molecules, but also their localization within the cell, and
in statistically meaningful numbers. The combination of these two
capabilities brings statistical robustness to image-based assays.
Experimental Design and Results
Podocalyxin (Podo) is a trans-membrane, CD34 protein family member expressed on podocytes and a number of hematopoietic precursor cells. The negatively charged ectodomain of Podo gives it an
anti-adhesive property that may be regulated by intracellular ligands.
These ligands may help govern the localization of Podo during cap
and pseudopod formation.
In the basic experimental protocol used for this study, an IL-3 dependent cell line was cytokine deprived for three hours and then
reintroduced to IL-3 for various times. Cells were fixed, permeabilized and stained with PE-tagged anti-Podo. The DNA binding dye
DRAQ5 was added to visualize the nucleus and help differentiate the
main body of the cell from the pseudopod that forms after re-addition of IL-3.
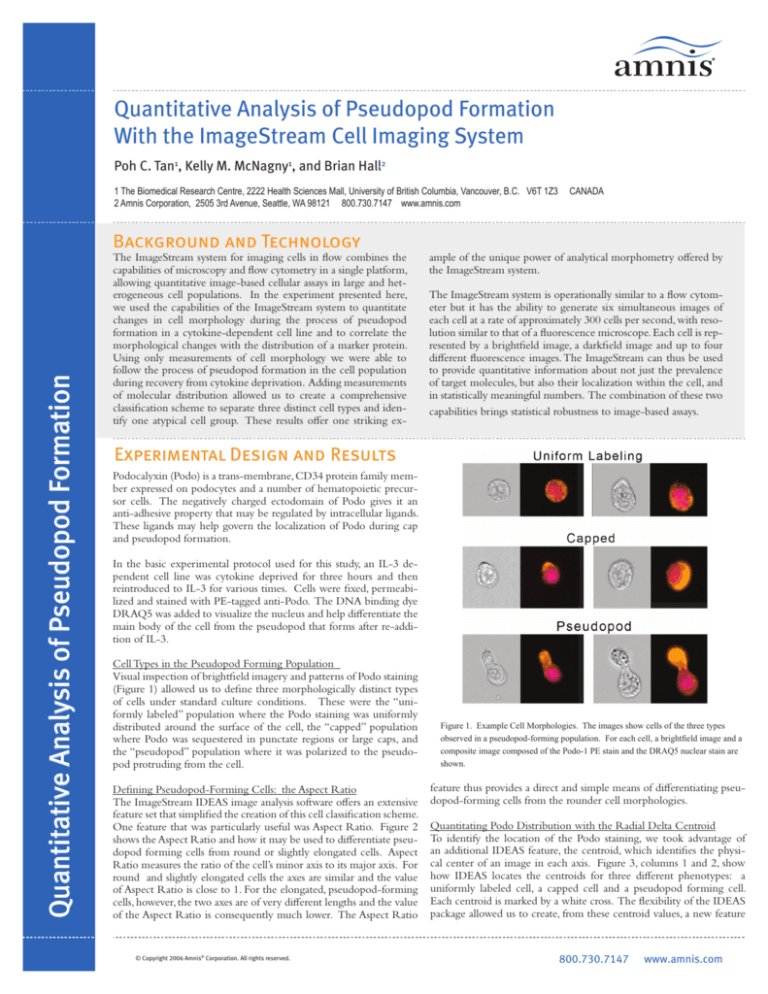
Cell Types in the Pseudopod Forming Population
Visual inspection of brightfield imagery and patterns of Podo staining
(Figure 1) allowed us to define three morphologically distinct types
of cells under standard culture conditions. These were the “uniformly labeled” population where the Podo staining was uniformly
distributed around the surface of the cell, the “capped” population
where Podo was sequestered in punctate regions or large caps, and
the “pseudopod” population where it was polarized to the pseudopod protruding from the cell.
Defining Pseudopod-Forming Cells: the Aspect Ratio
The ImageStream IDEAS image analysis software offers an extensive
feature set that simplified the creation of this cell classification scheme.
One feature that was particularly useful was Aspect Ratio. Figure 2
shows the Aspect Ratio and how it may be used to differentiate pseudopod forming cells from round or slightly elongated cells. Aspect
Ratio measures the ratio of the cell’s minor axis to its major axis. For
round and slightly elongated cells the axes are similar and the value
of Aspect Ratio is close to 1. For the elongated, pseudopod-forming
cells, however, the two axes are of very different lengths and the value
of the Aspect Ratio is consequently much lower. The Aspect Ratio
© Copyright 2006 Amnis® Corporation. All rights reserved.
Figure 1. Example Cell Morphologies. The images show cells of the three types
observed in a pseudopod-forming population. For each cell, a brightfield image and a
composite image composed of the Podo-1 PE stain and the DRAQ5 nuclear stain are
shown.
feature thus provides a direct and simple means of differentiating pseudopod-forming cells from the rounder cell morphologies.
Quantitating Podo Distribution with the Radial Delta Centroid
To identify the location of the Podo staining, we took advantage of
an additional IDEAS feature, the centroid, which identifies the physical center of an image in each axis. Figure 3, columns 1 and 2, show
how IDEAS locates the centroids for three different phenotypes: a
uniformly labeled cell, a capped cell and a pseudopod forming cell.
Each centroid is marked by a white cross. The flexibility of the IDEAS
package allowed us to create, from these centroid values, a new feature
800.730.7147
www.amnis.com
that we used to quantitate the distribution of Podo staining. The new
feature was called the Radial Delta Centroid and was calculated as shown
in column 3 of Figure 3.
Figure 2. Aspect Ratio. For each cell type, the major and minor axes are indicated in the
figure. The Aspect Ratio is determined as the ratio of the short axis to the long axis. Values
for each of the cells are given in the figure.
In cells whose PE and DRAQ5 centroids are similarly located, the delta
centroid values are small (row 1 composite image; delta centroid X = 0
and delta centroid Y = 0.3 pixels). However if Podo is localized to a pseudopod, the center of the PE image is far from the center of the nuclear
DRAQ5 image and the delta centroid values are larger (row 3 composite
image: delta centroid X = 8.3 pixels and a delta centroid Y = 21.8 pixels.)
Cell Classification Using Aspect Ratio and Radial Delta Centroid
Ultimately, we wanted to be able to characterize the entire cell population,
not just individual cells. This was done, as shown in Figure 4, by plotting
the Radial Delta Centroid feature against the Brightfield Aspect Ratio
feature. Pseudopod-forming cells had a high Radial Delta Centroid value
and a low Aspect Ratio value. Uniformly labeled cells had high Aspect
Ratio but low Radial Delta Centroid values. Capped cells had high Aspect
Ratio values but relatively low Radial Delta Centroid values. Each of the
cell types fell into its own distinct classification, showing that this plot can
be used to fully characterize the cell sample.
Time Course of Pseudopod Formation Following Cytokine Deprivation.
In this experiment, we deprived the cells of IL-3 for a period of 3 hours
and then reintroduced the culture to the cytokine. Samples of cells were
taken at 0, 15, 30 and 60 minutes, permeabilized, stained and run on the
ImageStream. Cell types were assigned using the classification scheme
developed in this report and the fraction of each type in the population at
each time point was calculated. The graph in Figure 5 shows the fraction
of cells that were uniformly labeled for Podo (blue), were capped (orange)
or were forming pseudopods (red). Over the time course, the fraction of
cells showing uniform labeling declined steadily, while the fraction showing pseudopod formation increased. The fraction of capped cells increased
at first and then declined.
Figure 3. Calculation of the Radial Delta Centroid Classifier. The IDEAS
software package automatically generates a centroid for each cell image,
indicated by white crosses in the figures. The Radial Delta Centroid is
created in IDEAS by calculating the differences between respective X and
Y axes and then deriving the radial values.
Figure 4. Graphing Radiao Deltra Centroid against Aspect Ratio
separates the cell population into distinct morphological classes.
Conclusions
In this report, we followed the course of pseudopod formation over time as cells
recovered from a period of cytokine deprivation. Cells deprived of IL-3 for
several hours lost their native morphology -- the presence of pseudopod forming cells declined. When reintroduced to the cytokine, cells formed pseudopods once again. This process can be correlated with the cellular distribution of
Podo. As the process begins, the frequency of pseudopod forming cells is very
low and Podo is uniformly distributed over the cell surface. Then the protein
coalesces into a cap on the cell surface, defining the location for pseudopod
formation. Finally, the cell elongates, creating a familiar proboscis-like structure
and Podo is almost entirely localized in the new pseudopod.
This study presents a compelling example of how quantitative analysis of cell
morphology and molecular distribution with the ImageStream system may be
used to gather information on a cell population that would be unobtainable
otherwise.
© Copyright 2006 Amnis® Corporation. All rights reserved.
Figure 5. Time Course of Pseudopod Formation. The percent of the cell
population in each of the three classes identified using the Radial Delta
Centroid vs. Brightfield Aspect Ratio plot.
800.730.7147
www.amnis.com


