Psicheck empty
advertisement
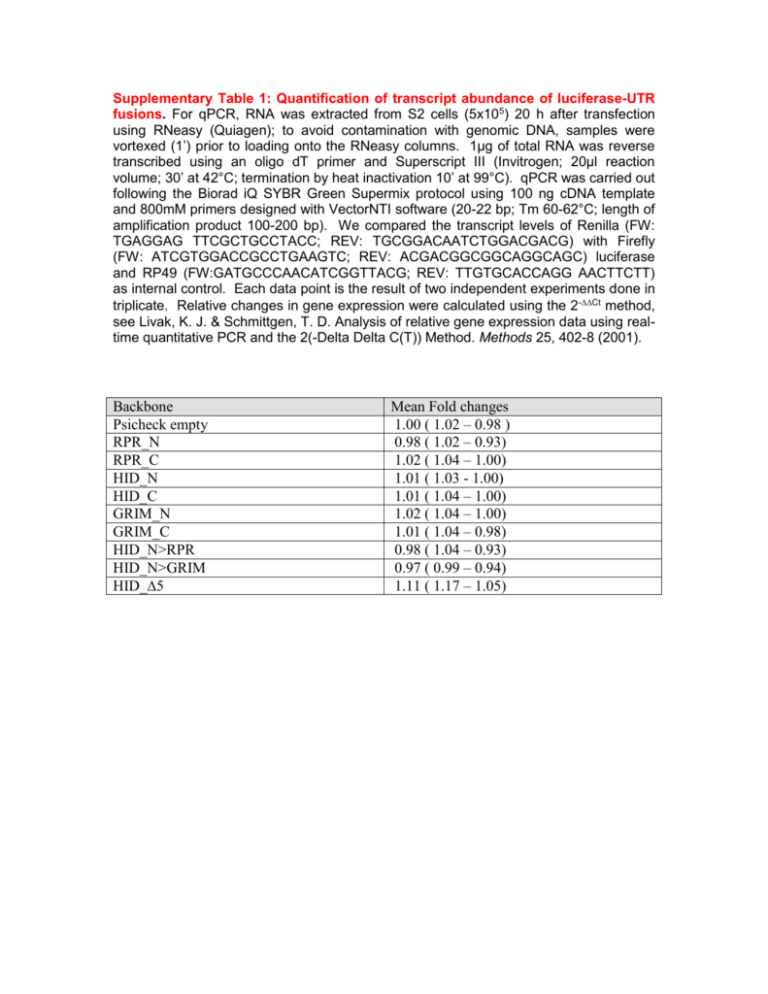
Supplementary Table 1: Quantification of transcript abundance of luciferase-UTR fusions. For qPCR, RNA was extracted from S2 cells (5x10⁵) 20 h after transfection using RNeasy (Quiagen); to avoid contamination with genomic DNA, samples were vortexed (1’) prior to loading onto the RNeasy columns. 1µg of total RNA was reverse transcribed using an oligo dT primer and Superscript III (Invitrogen; 20µl reaction volume; 30’ at 42°C; termination by heat inactivation 10’ at 99°C). qPCR was carried out following the Biorad iQ SYBR Green Supermix protocol using 100 ng cDNA template and 800mM primers designed with VectorNTI software (20-22 bp; Tm 60-62°C; length of amplification product 100-200 bp). We compared the transcript levels of Renilla (FW: TGAGGAG TTCGCTGCCTACC; REV: TGCGGACAATCTGGACGACG) with Firefly (FW: ATCGTGGACCGCCTGAAGTC; REV: ACGACGGCGGCAGGCAGC) luciferase and RP49 (FW:GATGCCCAACATCGGTTACG; REV: TTGTGCACCAGG AACTTCTT) as internal control. Each data point is the result of two independent experiments done in triplicate. Relative changes in gene expression were calculated using the 2-Ct method, see Livak, K. J. & Schmittgen, T. D. Analysis of relative gene expression data using realtime quantitative PCR and the 2(-Delta Delta C(T)) Method. Methods 25, 402-8 (2001). Backbone Psicheck empty RPR_N RPR_C HID_N HID_C GRIM_N GRIM_C HID_N>RPR HID_N>GRIM HID_∆5 Mean Fold changes 1.00 ( 1.02 – 0.98 ) 0.98 ( 1.02 – 0.93) 1.02 ( 1.04 – 1.00) 1.01 ( 1.03 - 1.00) 1.01 ( 1.04 – 1.00) 1.02 ( 1.04 – 1.00) 1.01 ( 1.04 – 0.98) 0.98 ( 1.04 – 0.93) 0.97 ( 0.99 – 0.94) 1.11 ( 1.17 – 1.05)
