Supplementary Information Scheme S1 The “deposition
advertisement
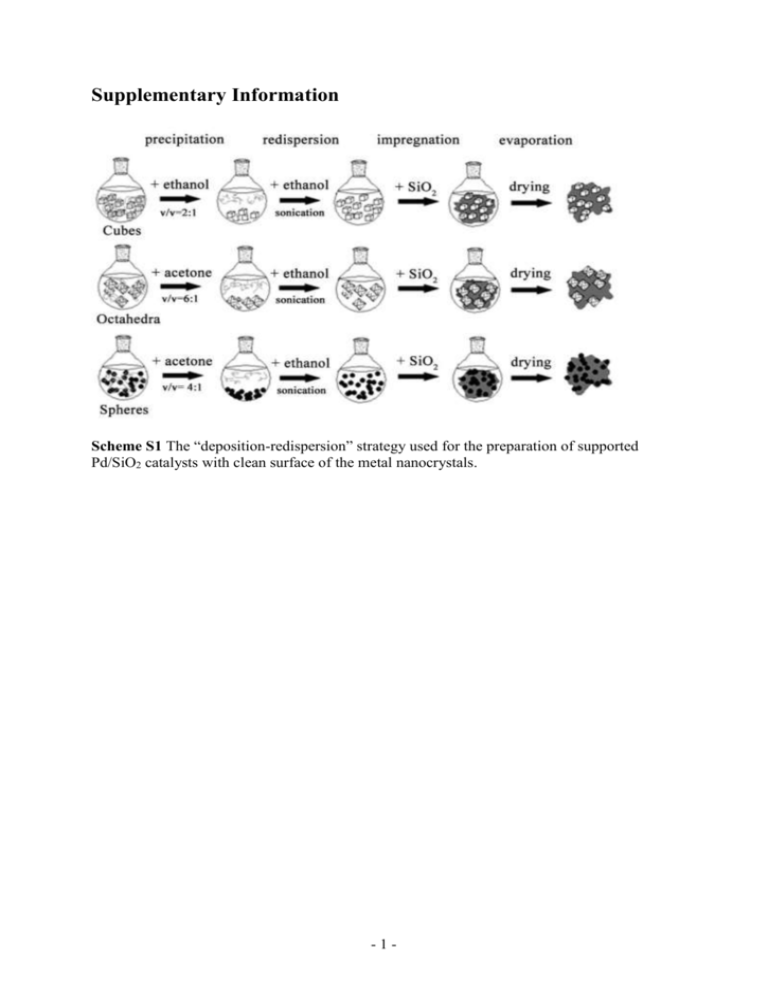
Supplementary Information Scheme S1 The “deposition-redispersion” strategy used for the preparation of supported Pd/SiO2 catalysts with clean surface of the metal nanocrystals. -1- Fig. S1 Size distributions of the cubic (a), octahedral (b) and spherical (c) Pd nanoparticles. Approximately 120 particles were counted for each figure. 30 a Size distribution /% 25 20 15 10 5 0 2 4 6 8 10 12 14 16 18 20 22 24 26 Particle size (diagonal) / nm 30 b Size distribution / % 25 20 15 10 5 0 2 4 6 8 10 12 14 16 18 20 22 24 26 Particle size (verte to vertex) / nm 30 c Size distribution / % 25 20 15 10 5 0 2 4 6 8 10 12 14 16 18 20 22 24 26 Particle size (diameter) / nm -2- Fig. S2 SAED patterns obtained from a single Pd nanocube (a) and Pd octahedron (b). a b -3- Fig. S3 SEM images of Pd cubes (a, b) and Pd octahedra (c). a b c -4- Fig. S4 The Fourier transform infrared spectroscopy (FT-IR) of Pd (octahedron)/SiO2 at different stages of the supporting procedure. PVP was used as the capping agent here, which should be removed before the catalytic activity evaluation. The three characteristic peaks of PVP at 1436, 1670 and 2930 cm-1 disappeared after the “precipitation-redispersion” method, indicating an effective elimination of PVP. Transmittance / a.u. SiO2 1436 1670 PVP 2930 PVP + SiO2 Pd octahedra/ SiO2 1000 1500 2000 2500 3000 Wavenumber / cm 3500 -1 -5- 4000 Fig. S5 The corresponding Arrhenius plots for comparison of apparent activation energies for CO oxidation reaction of the different as-synthesized Pd/SiO2 catalysts. ln [Turnover Frequency] / s -1 0 cube octahedron sphere -1 -2 -3 -4 -5 -6 -7 -8 0.0016 0.0018 0.0020 0.0022 -1 0.0024 -1 Temperature / K Table S1 Apparent activation energies based on the Arrhenius plots data and related data of supported Pd catalysts. Pd catalysta actual loadingb / wt% surface atom ratioc dispersiond TOFe/ s-1 Ea/ kJ mol-1 cube octahedron sphere 2.91 2.94 2.89 0.15 0.12 0.38 0.68 0.61 0.72 0.52 0.69 0.19 76.5 52.9 42.6 a Loaded on fumed silica. b Elemental analyses determined by ICP-AES. c The approximate percentage of the surface atoms to the overall bulk atoms. d Based on CO chemisorption isotherm. e Maximum TOF measured for all the catalysts. Note: Here the TOF values were calculated as the following equation (actual Pd loading, Pd dispersion and surface atom ratio were all taken into account): Fgas CCO X CO TOF= m Pd D S M Pd Where Fgas is the total molar flow rate, CCO is the concentration of CO in gas mixture, XCO is the conversion of CO, mPd is the mass of Pd in the reactor bed, MPd is the Pd atom weight, D is the Pd dispersion obtained from the CO chemisorption, S is the percentage of surface atoms to the overall bulk atoms (or surface atom ratio), which was calculated based on the shape and size of the Pd nanocrystals in our experiments. -6- Fig. S6 TEM images of the Pd nanospheres with the average size of 3.9 nm (A, a), 7.5 nm (B, b) and 9.6 nm (C, c). A a B b C c -7- Fig S7 Size distributions of the Pd nanospheres with the size of 3.9 nm (a), 7.5 nm (b), 9.6 (c) nm. Approximately 120 particles were counted for each figure. a Size distribution / % 30 size=3.9 nm 25 20 15 10 5 0 2 4 6 8 10 12 14 Particle size / nm 18 size=7.5 nm b Size distribution / % 15 12 9 6 3 0 2 6 8 10 Particle size / nm 12 14 c size= 9.6 nm 15 Size distribution / % 4 12 9 6 3 0 2 4 6 8 10 12 14 Particle size / nm -8- Fig. S8 The CO oxidation activities over the Pd (sphere)/SiO2 catalysts with the average size of 3.9 nm, 7.5 nm and 9.6 nm. The CO oxidation activity were evaluated in a packed-bed flow reactor using 50 mg of catalyst (40–60 mesh size) in a gas mixture of 1.0 % CO, 1.0 % O2 in 98 % N2 at a flow rate of 97.2 mL min-1 and a space velocity of 32.4 mL s-1 g-1. 100 Conversion / % 80 3.9 nm 7.5 nm 9.6 nm 60 40 20 0 50 100 150 200 250 300 o Temperature / C Fig. S9 The DRIFT spectra of CO adsorption on Pd (cube)/SiO2 under different temperatures. Intensity / a.u. 1878 1932 o 350 C o 250 C o 30 C 1940 2200 2100 2000 1900 Wavenumber/ cm 1800 -1 -9- 1700


