Supplementary methods
advertisement
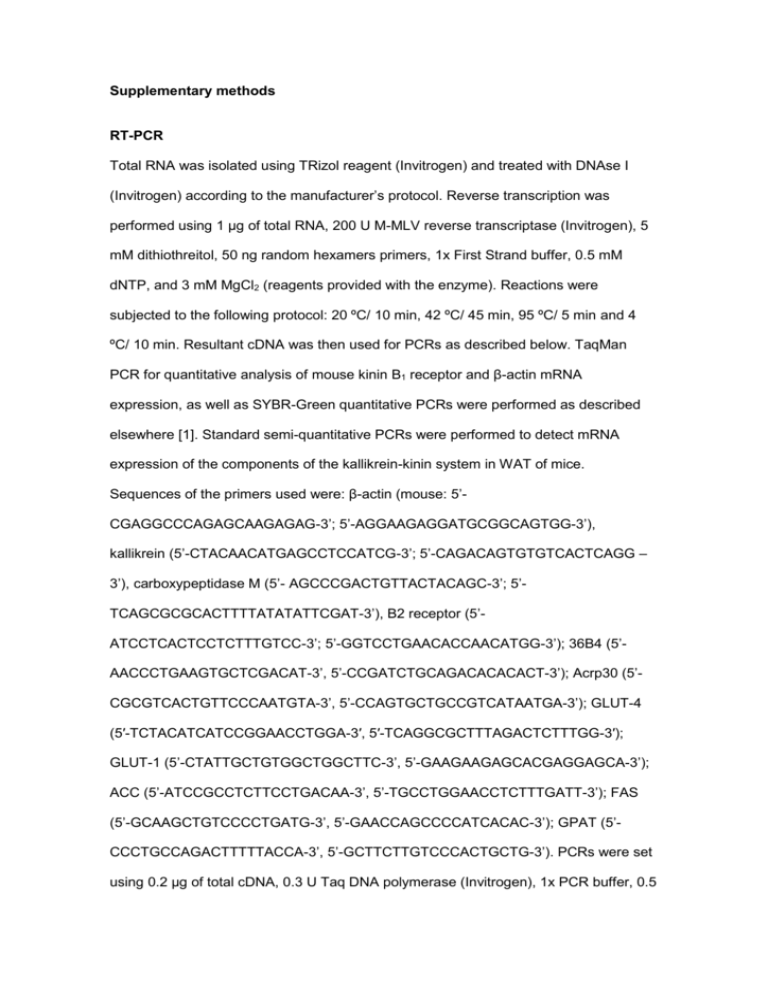
Supplementary methods RT-PCR Total RNA was isolated using TRizol reagent (Invitrogen) and treated with DNAse I (Invitrogen) according to the manufacturer’s protocol. Reverse transcription was performed using 1 μg of total RNA, 200 U M-MLV reverse transcriptase (Invitrogen), 5 mM dithiothreitol, 50 ng random hexamers primers, 1x First Strand buffer, 0.5 mM dNTP, and 3 mM MgCl2 (reagents provided with the enzyme). Reactions were subjected to the following protocol: 20 ºC/ 10 min, 42 ºC/ 45 min, 95 ºC/ 5 min and 4 ºC/ 10 min. Resultant cDNA was then used for PCRs as described below. TaqMan PCR for quantitative analysis of mouse kinin B1 receptor and β-actin mRNA expression, as well as SYBR-Green quantitative PCRs were performed as described elsewhere [1]. Standard semi-quantitative PCRs were performed to detect mRNA expression of the components of the kallikrein-kinin system in WAT of mice. Sequences of the primers used were: β-actin (mouse: 5’CGAGGCCCAGAGCAAGAGAG-3’; 5’-AGGAAGAGGATGCGGCAGTGG-3’), kallikrein (5’-CTACAACATGAGCCTCCATCG-3’; 5’-CAGACAGTGTGTCACTCAGG – 3’), carboxypeptidase M (5’- AGCCCGACTGTTACTACAGC-3’; 5’TCAGCGCGCACTTTTATATATTCGAT-3’), B2 receptor (5’ATCCTCACTCCTCTTTGTCC-3’; 5’-GGTCCTGAACACCAACATGG-3’); 36B4 (5’AACCCTGAAGTGCTCGACAT-3’, 5’-CCGATCTGCAGACACACACT-3’); Acrp30 (5’CGCGTCACTGTTCCCAATGTA-3’, 5’-CCAGTGCTGCCGTCATAATGA-3’); GLUT-4 (5′-TCTACATCATCCGGAACCTGGA-3′, 5′-TCAGGCGCTTTAGACTCTTTGG-3′); GLUT-1 (5’-CTATTGCTGTGGCTGGCTTC-3’, 5’-GAAGAAGAGCACGAGGAGCA-3’); ACC (5’-ATCCGCCTCTTCCTGACAA-3’, 5’-TGCCTGGAACCTCTTTGATT-3’); FAS (5’-GCAAGCTGTCCCCTGATG-3’, 5’-GAACCAGCCCCATCACAC-3’); GPAT (5’CCCTGCCAGACTTTTTACCA-3’, 5’-GCTTCTTGTCCCACTGCTG-3’). PCRs were set using 0.2 μg of total cDNA, 0.3 U Taq DNA polymerase (Invitrogen), 1x PCR buffer, 0.5 mM dNTPs, and 2.5 mM MgCl2 (reagents provided with the enzyme) and 50 ng primers. Reactions were subjected to 95 ºC/ 5 min and 35 cycles of 95 ºC/ 20 s, 60 ºC/ 20 s and 72 ºC/ 40 s. Antibodies AKT (#9272), phospho-AKT (Ser473) (#9271), ERK (#9102) and phospho-ERK (Thr202, Tyr204) (#9101) antibodies were purchased from Cell Signaling Technologies. GLUT4 (#AB1346) antibody was obtained from Chemicon. IRS-1 (#06248) and p85 PI3K subunit (#06-195) antibodies were purchased from Upstate. Isolation of mouse adipocytes Adipocytes were isolated from epididymal fat pads using a slight modification of Rodbell’s method [2]. Briefly, mice were killed and epididymal fat pads were removed, minced and incubated for 15 minutes at 37 ºC under orbital shaking (150 rpm) in DMEM with 5 mM glucose containing 1.25 mg/mL collagenase, 25 mM HEPES and 4 % BSA (Sigma), pH 7.4. At the end of the incubation, cells were filtered through a 500 μm nylon mesh, washed three times with DMEM with 5 mM glucose containing 20 mM HEPES, 1 % BSA and 10 % FBS, pH 7.4, and the resultant suspension containing the fat cells was used for experiments. Images of isolated adipocytes were acquired using a light microscope fitted with a camera and the cellular volume was estimated using a graduated ocular according to the DiGirolamo’s method [3]. Protein extraction, immunoprecipitation and western blotting Tissues and cells were homogenized at 4 °C in RIPA buffer [50 mM tris, pH 7.4; 1 % NP-40; 0.25 % sodium deoxycholate; 150 mM NaCl; 1 mM EDTA; Complete protease inhibitors (Roche); 1 mM sodium orthovanadate; 1 mM sodium fluoride] and protein content in the lysates was quantified using the Bio-Rad DC Protein Assay kit. Cell lysates were diluted in RIPA buffer and 4 x loading buffer (125 mM tris pH 6.8; 1.25 % 2 glycerol; 4 % sodium dodecyl sulfate; 15 mg/mL dithiothreitol; 0.02 % bromophenol blue) to a final concentration of 5 mg/mL and boiled. 10 μL of the lysates were subjected to SDS-PAGE, transferred to PVDF membranes (GE Healthcare) and immunoblotted. Horseradish peroxidase activity was detected by chemiluminescence using the ECL Plus kit. Alternatively, 500 μL of lysates containing 1 mg of total protein were incubated overnight at 4°C with 25 μL of Protein G-sepharose beads (GE Healthcare) and 4 μg of anti-PI3K antibody (Upstate). In the following day, samples were washed four times with cold RIPA and the pellet was resuspended in 2 x loading buffer and boiled. The supernatant was analyzed by SDS-PAGE as described above. Low density microsomes and plasma membrane fractions from 3T3-L1 adipocytes and WAT of wild type (WT) and B1-/- mice were isolated for quantification of GLUT4 expression based on a protocol described elsewhere [4]. Total protein content was determined in the solubilized membrane fractions and equal amounts of protein were analyzed by SDS-PAGE and immunoblotting. RNase protection assay Expression of the aP2-B1 transgene was determined using RNase protection assay (RPA III kit, Ambion). The probe corresponded to the antisense transcript resulted of the amplification of the transgene using the following primers: 5’TGGACTTCAGAGGCTCATAG-3’ and 5’-CCAGCAACCTGTAGCGGTCC-3’. The PCR fragment was cloned into pGEM-T Easy vector and used as template for in vitro transcription. Briefly, the probe was labeled with α-[32P]-UTP and incubated overnight at 42 °C with 50 μg of total RNA. The incubation products were subjected to 5% acrylamide / 8M urea gel electrophoresis. The gel was dried out, exposed to an X-ray film for 16 hours and developed using a PhosphoImager (Fuji). Southern Blotting The probe was synthesized by PCR using an aP2-B1 transgene-specific set of primers (5’-TGGACTTCAGAGGCTCATAG-3’ and 5’-CCAGCAACCTGTAGCGGTCC-3’). The fragment was purified through a silica gel column and labeled with α-[32P]-CTP using the Prime-It kit Random Primer Labeling RmT (Ambion). The genomic DNA was extracted using DNeasy kit (Qiagen), digested with Sac I and subjected to 1% agarose gel electrophoresis. The gel was dipped in a solution of 0.2 M HCl for 10 minutes for depurination of the DNA, rinsed briefly with water, incubated for 30 min with denaturation solution (1.5 M NaCl, 0.5 M NaOH) and then for another 30 minutes with neutralizing solution (1.5 M NaCl, 1 M Tris, pH 7.5). DNA was transferred by capillarity from the gel to a Hybond-N nylon membrane (GE Healthcare) and cross-linked using ultraviolet light. The membrane was incubated overnight at 62°C with an incubation solution (50 mM Tris pH 8.0, 10 mM EDTA, 5 x SSC, 1 x Denhardt’s, 0.2 % SDS, 100 mg/mL salmon sperm DNA) containing the labeled probe. After a series of washes with a gradient of SSC and SDS (2 x SSC 0.5% SDS, 0.5 x SSC 0.1% SDS, 0.1 x SSC 0.1% SDS), the membrane was exposed to a film for 16 hours and developed using a PhosphoImager (Fuji). Histology Adipose tissues were extracted, weighed and fixed with 10% buffered formalin and embedded in paraffin. Sections were stained with hematoxylin and eosin. Image capture and analysis were performed using ImageJ software. 4 Supplemental references 1. Mori MA, Araujo RC, Reis FC, Sgai DG, Fonseca RG, et al. (2008) Kinin B1 receptor deficiency leads to leptin hypersensitivity and resistance to obesity. Diabetes 57: 1491-1500. 2. Rodbell M (1964) Metabolism of Isolated Fat Cells. I. Effects of Hormones on Glucose Metabolism and Lipolysis. J Biol Chem 239: 375-380. 3. Fine JB, DiGirolamo M (1997) A simple method to predict cellular density in adipocyte metabolic incubations. Int J Obes Relat Metab Disord 21: 764768. 4. Bogan JS, McKee AE, Lodish HF (2001) Insulin-responsive compartments containing GLUT4 in 3T3-L1 and CHO cells: regulation by amino acid concentrations. Mol Cell Biol 21: 4785-4806.

