Final Project
advertisement
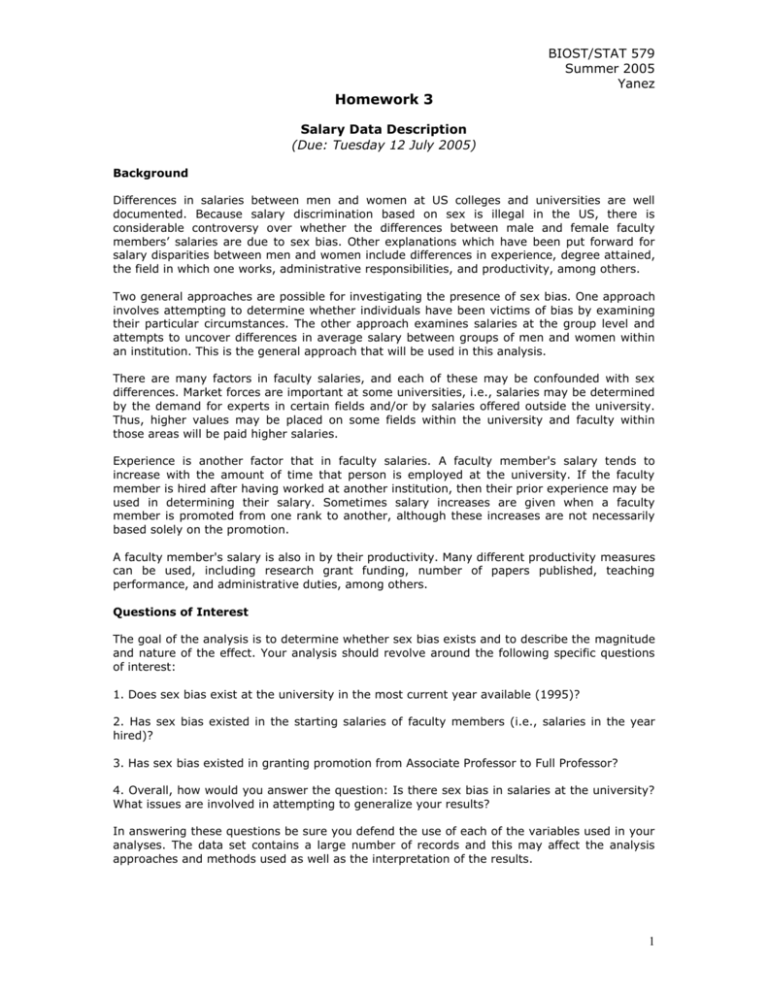
Homework 3 BIOST/STAT 579 Summer 2005 Yanez Salary Data Description (Due: Tuesday 12 July 2005) Background Differences in salaries between men and women at US colleges and universities are well documented. Because salary discrimination based on sex is illegal in the US, there is considerable controversy over whether the differences between male and female faculty members’ salaries are due to sex bias. Other explanations which have been put forward for salary disparities between men and women include differences in experience, degree attained, the field in which one works, administrative responsibilities, and productivity, among others. Two general approaches are possible for investigating the presence of sex bias. One approach involves attempting to determine whether individuals have been victims of bias by examining their particular circumstances. The other approach examines salaries at the group level and attempts to uncover differences in average salary between groups of men and women within an institution. This is the general approach that will be used in this analysis. There are many factors in faculty salaries, and each of these may be confounded with sex differences. Market forces are important at some universities, i.e., salaries may be determined by the demand for experts in certain fields and/or by salaries offered outside the university. Thus, higher values may be placed on some fields within the university and faculty within those areas will be paid higher salaries. Experience is another factor that in faculty salaries. A faculty member's salary tends to increase with the amount of time that person is employed at the university. If the faculty member is hired after having worked at another institution, then their prior experience may be used in determining their salary. Sometimes salary increases are given when a faculty member is promoted from one rank to another, although these increases are not necessarily based solely on the promotion. A faculty member's salary is also in by their productivity. Many different productivity measures can be used, including research grant funding, number of papers published, teaching performance, and administrative duties, among others. Questions of Interest The goal of the analysis is to determine whether sex bias exists and to describe the magnitude and nature of the effect. Your analysis should revolve around the following specific questions of interest: 1. Does sex bias exist at the university in the most current year available (1995)? 2. Has sex bias existed in the starting salaries of faculty members (i.e., salaries in the year hired)? 3. Has sex bias existed in granting promotion from Associate Professor to Full Professor? 4. Overall, how would you answer the question: Is there sex bias in salaries at the university? What issues are involved in attempting to generalize your results? In answering these questions be sure you defend the use of each of the variables used in your analyses. The data set contains a large number of records and this may affect the analysis approaches and methods used as well as the interpretation of the results. 1 BIOST/STAT 579 Summer 2005 Yanez The Data The data to be used in this analysis consist of faculty members' salaries at a single US university. Data were collected on 1,597 faculty members employed at the university in 1995 (medical school faculty were excluded). Monthly salary was determined for each faculty member for each year from 1976 through 1995. Other variables available include sex, highest degree attained, year of highest degree, field, year hired, rank, and administrative duties. Note that the last two variables may change over time but the others are constant over time. The file salary.txt is in ASCII format with tabs separating the fields and can be downloaded from the class web page at (http://faculty.washington.edu/yanez/b579/salary.txt). Each record in the data file represents the information on salary and the other variables for a particular year (there are 19,792 records). The variable names and description are given below: Id Identification number for the faculty member sex M (male) or F (female) deg highest degree attained: PhD, Prof (professional degree, e.g., medicine or law), or Other (Master's or Bachelor's degree) yrdeg year highest degree attained field Arts (Arts and Humanities), Prof (professional school, i.e., Business, Law, Engineering or Public Affairs), or Other startyr year in which the faculty member was hired (2 digits) year year (2 digits) rank rank of the faculty member in this year: Assist (Assistant), Assoc (Associate), or Full (Full) admin indicator of whether the faculty member had administrative duties (e.g., department chair) in this year: 1 (yes), or 0 (no) salary monthly salary of the faculty member in this year in dollars Admin indicator of whether the faculty member had administrative duties (e.g., department chair) in this year (1=yes, 0=no). 2 BIOST/STAT 579 Summer 2005 Yanez Assignment In this assignment, you will prepare the background and outline the statistical methods that you will use to investigation the questions of interest. Your report should look like the sections of a formal manuscript to be submitted to an applied journal. Because a statistical analysis aims to answer a scientific question, the sections of your report should be organized in the manner which is customarily used in science. To wit: Background: Provide a description of the scientific motivation for the analysis. Use your own words rather than copying the description provided by the client. By providing your understanding of the problem, the client may be able to correct any misconceptions that you had about the science. You don't have to go into great detail here, but do give all the facts that entered into your decision process during the analysis. The Questions of Interest belongs here. State the specific questions that have been posed. Statistical Methods: Describe the methods used for the analysis at a level appropriate for an applied audience. Include references for non-standard techniques. You may want to describe the software used, and certainly want to describe the methods used for assessing the appropriateness of your models. Explain how you handled common problems like missing data, multiple comparisons, etc. Provide interpretations for all parameter estimates used to answer relevant scientific questions. Motivate transformations. Describe the use of P values and confidence intervals if they play an important role in your analysis. Explain why you didn't use more common techniques if necessary. The major theme of the above is to write to the scientific community rather than to a statistician. In a future assignment, we will proceed to write the results, discussion and appendices 3


