Supplement material to Emissions of anthropogenic VOCs in
advertisement
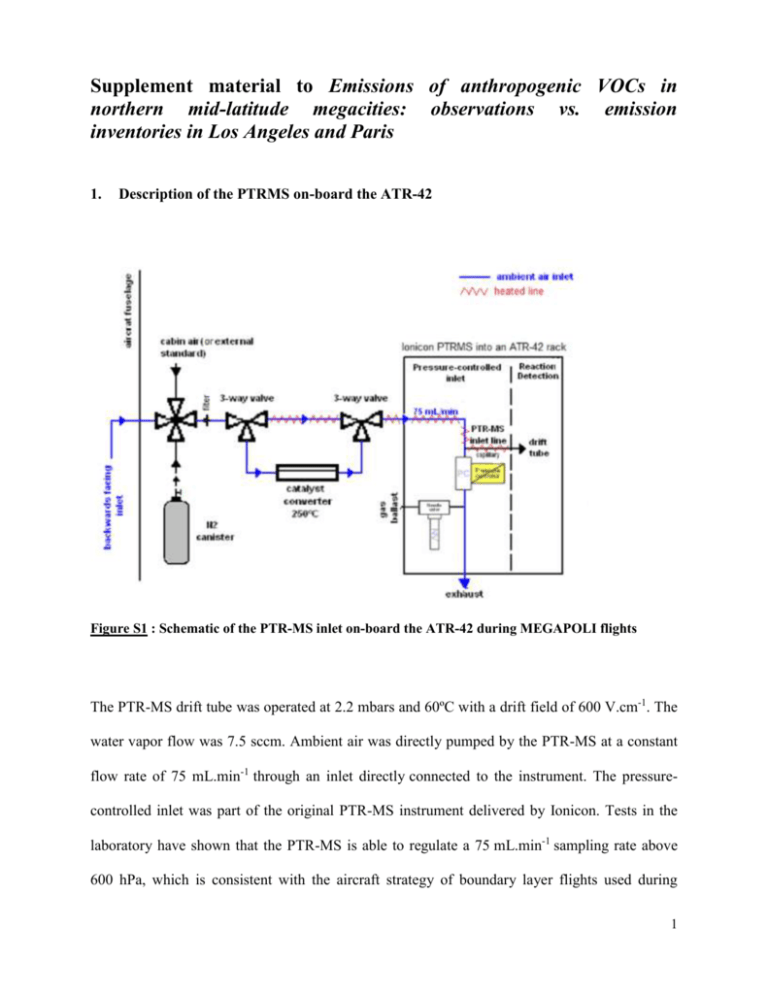
Supplement material to Emissions of anthropogenic VOCs in northern mid-latitude megacities: observations vs. emission inventories in Los Angeles and Paris 1. Description of the PTRMS on-board the ATR-42 Figure S1 : Schematic of the PTR-MS inlet on-board the ATR-42 during MEGAPOLI flights The PTR-MS drift tube was operated at 2.2 mbars and 60ºC with a drift field of 600 V.cm-1. The water vapor flow was 7.5 sccm. Ambient air was directly pumped by the PTR-MS at a constant flow rate of 75 mL.min-1 through an inlet directly connected to the instrument. The pressurecontrolled inlet was part of the original PTR-MS instrument delivered by Ionicon. Tests in the laboratory have shown that the PTR-MS is able to regulate a 75 mL.min-1 sampling rate above 600 hPa, which is consistent with the aircraft strategy of boundary layer flights used during 1 MEGAPOLI. The aircraft inlet consists of 2-m PEEK, (1/16”) and Teflon (1/8”) tubing. The inlet temperature is controlled at 60ºC. A filter of 0.45 m (Waters) prevents from any blockage of the inlet; the same filter was used during the whole campaign. A 4-way valve is installed upstream to sample either ambient air, air from the cabin during take-off and landing and external gases (N2 canister to flush the inlet and the PTR-MS after the flight or any other gaseous standard). Instrumental background signal was determined through periodic air sampling of ambient air scrubbed through a custom-built catalyst converter (platinum-coated steel wool) heated to 250ºC. In background measurement mode, the ambient air flow is diverted to the catalyst by two 3-way valves. Typical background counts for aromatics were between 0.8 and 10 counts.sec-1. Detection limits, defined as the 1 variability in the background mixing ratios, were between 0.070 ppb and 0.150 ppb for a 2 sec-dwell time. The measurement frequency was less than one minute. H3O+ count rates were typically over 5×10⁶ counts s−1. A complete calibration over a 0.1-20 ppb range was performed before and after the campaign. The standard gas used was provided by Ionimed (Innsbruck, Austria) and contained several VOCs including benzene, toluene and oxylene at 1 ppm certified at ±5%. A second gaseous standard from NPL (UK) to cross-check the quality of the calibration for isoprene and C6-C9 aromatics was also used (4 ppb ±0.8 ppb). A relative difference of less than 10% was found. During the campaign, three calibration controls using the secondary gaseous standard were made at ground level. The calibration factor for all major VOCs (the slope of the mixing ratio with respect to product ion signal normalized to H3O+) ranged from 5 to 20 counts sec-1 ppb-1. 2 2. Application of the photochemical age method 2.1. Equations used in the photochemical age method Following de Gouw et al. [2005] and Warneke et al. [2007], the data reported in Figure 3 can be described by two equations that are resolved by a multi-linear least-square regression fit. Primary VOCs are described by a removal term as follows: [VOC] ER VOC exp[(k VOC k C2 H )[OH]Δt ] 2 [C 2 H 2 ] (eq. S1) where [VOC] and [C2H2] are the volume mixing ratios of the VOC and acetylene, ERVOC is the emission ratio of the VOC relative to acetylene, kVOC and kC2H2 are the OH rate coefficients for the reaction of those compounds with OH (5.106 molecules.cm-3) and t is the photochemical age calculated (see next section 2.2). OVOC are described by an additional secondary production term as follows: [OVOC] ER OVOC [C 2 H 2 ] exp[(k OVOC k C2H )[OH]Δt ] 2 ER precursor [C 2 H 2 ] k precursor k OVOC k precursor + [background] exp(k precursor[OH]Δt ) exp(k OVOC [OH]Δt exp(k C2H2 [OH]Δt ) (eq. S2) where the first term is the chemical removal term of the primary anthropogenic OVOC emissions similarly to equation S1. The second term represents the production and removal of secondary anthropogenic OVOC with ERprecursor the emission ratio relative to acetylene for the OVOC and kprecursor the OH rate coefficient for the precursor. The third term is the OVOC volume mixing ratio in background conditions. kOVOC are taken from Atkinson and Arey [2003] whereas 3 kprecursor, EROVOC, ERprecursor and [background] are determined from a linear least-square regression fit that minimizes the difference between measured OVOC mixing ratios and those calculated from equation S2. 2.2. Determination of the photochemical age (t) The 1,2,4-trimethylbenzene (124TMB) over benzene ratio is used here for the Pasadena data instead of the more commonly used toluene over benzene ratio because the transport time of the Los Angeles plume to the receptor site is too short (less than 4 hours) to result in any changes in toluene relative to benzene as seen in Figure 1 at midday. The photochemical age of an air mass, ∆t, is calculated as follows: Δt [124TMB] [124TMB] ln ln [OH](k124T MB k benzene) [benzene] t 0 [benzene] 1 (eq. 1) where k124TMB (32.5×10⁻¹² cm3.molec-1.s-1) and kbenzene (1.22×10⁻¹² cm3.molec-1.s-1) are the reaction rate coefficients with OH of 1,2,4-trimethylbenzene and benzene, respectively; [124TMB] and [benzene] are the mixing ratios in ppb of benzene and 1,2,4-trimethylbenzene, respectively. [OH], the concentration of hydroxyl radical, is set to 5x10⁶ molec.cm-3. The emission ratios determined with the photochemical age method are not affected (less than 0.1%) when reducing or increasing the OH values by a factor of 2 as already seen by Warneke et al. [2007]. The ratio of [124TMB] over [benzene] at time zero (t=0) defines the emission ratio at a photochemical age of zero. This emission ratio was derived from a scatter plot of [124TMB] vs. [benzene] reported in Figure S2. The emission ratio is derived from the steeper line fitting the upper limit of the scatterplot’s envelop. The slope of the steeper line corresponds 4 to the emission enhancement ratio at nighttime data where photochemical processing can be neglected. A value of 0.55 ppb/ppb has been set. Sensitivity tests show that a ±0.10 ppb/ppbvariation of the [124TMB]/[benzene] value at time zero would affect the values of emission ratios of other VOCs within a 1-11% absolute range for alkanes, C6-C8 aromatics and C2-C3 alkenes and within a 19-28% absolute range for butenes and trimethylbenzenes. Among OVOCs, the emission ratio of acetaldehyde is the most affected OVOC by ±50%. Figure S2: Scatterplot of 1,2,4-trimethylbenzene vs. benzene in Pasadena. The bold line is the slope of the steeper line fitting the upper limit of the scatterplot envelop. The dashed lines are the slopes of the lines when the slope value of the steeper line varies by ± 0.10 ppb/ppb. 5 2.3. Results of the emission ratio calculation from the photochemical age method Table S1: Urban emission ratios of VOCs determined in Los Angeles by applying the photochemical age method to data collected at the ground site during CalNex. 6 3. Method for the evaluation of the emission inventories in Los Angeles and Paris In Los Angeles and Paris, the emissions of individual VOCs were extracted for a small area including the ground sites and a larger area covering the regional scale (Figure S3). In Los Angeles, the small square is centered on the Cal-Tech super site (34.073 º to 34.179 º latitude, 118.172 º to -118.044 º longitude, 144 km2) and the large square covers the LA basin (33.54º to 34.123º latitude, -118.5º to -117.8 longitude, 4032 km2). In Paris, the small area mostly corresponds to Paris intra-muros site (48.810º to 48.891º latitude, 2.256º to 2.475º longitude, 180 km2) and the larger area corresponds to the greater Paris area (48.366º to 49.089º latitude, 2.156º to 2.589º longitude, 3800 km2). NEI-2005 Weekday Non-point VOC emissions (ton/day/grid) MEGAPOLI-2005 Weekday Non-point VOC emissions (ton/day/grid) Los Angeles area Paris area Figure S3 : Small and large areas over Los Angeles and Paris considered for the emission ratio comparison. 7 Los Angeles Paris Inventory NEI-2005 CARB-2008 AIRPARIF Passant-2002 AIRPARIF IER-2006 tracer CO CO CO CO tracer acetylene - acetylene acetylene alkanes propane, ethane ethane, propane ethane, propane, butanes (n+iso), pentanes (n+iso), n-hexane, n-heptane same list as observations alkenes ethylene, propene, butenes ethylene, propene ethylene, propene, trans2-butene same list as observations aromatics benzene, toluene, (m+p)-xylenes, styrene 0.3 benzene + toluene+ethylbenzene C8-C9 aromatics benzene, toluene, xylenes (m+p,o), ethylbenzene, propylbenzene, sum trimethylbenzenes same list as observations oxygenated VOCs acetaldehyde, butanal, propanal, benzaldehyde, acetone, methacrolein, methylethylketone, methanol, ethanol, isopropanol acetaldehyde, benzaldehyde, methanol, acetone, methylethylketone - - Table S2: List of trace gases used for the comparison between inventories and observations in Los Angeles and Paris. 8
