"Weather Or Not - Moore Public Schools
advertisement
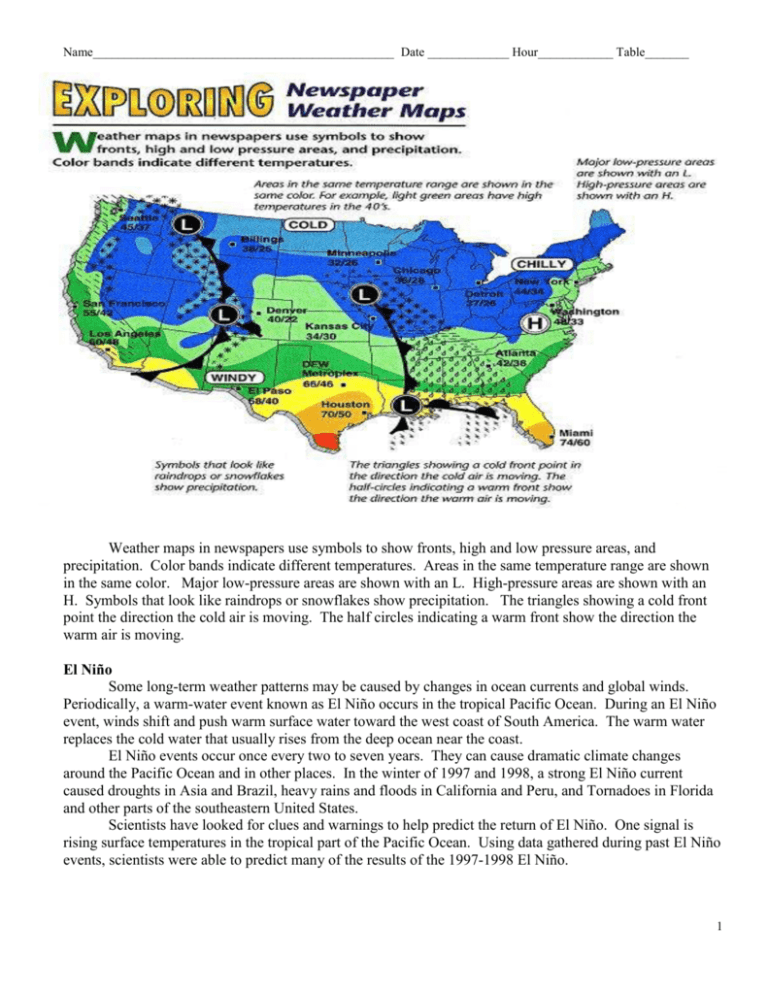
Name________________________________________________ Date _____________ Hour____________ Table_______ Weather maps in newspapers use symbols to show fronts, high and low pressure areas, and precipitation. Color bands indicate different temperatures. Areas in the same temperature range are shown in the same color. Major low-pressure areas are shown with an L. High-pressure areas are shown with an H. Symbols that look like raindrops or snowflakes show precipitation. The triangles showing a cold front point the direction the cold air is moving. The half circles indicating a warm front show the direction the warm air is moving. El Niño Some long-term weather patterns may be caused by changes in ocean currents and global winds. Periodically, a warm-water event known as El Niño occurs in the tropical Pacific Ocean. During an El Niño event, winds shift and push warm surface water toward the west coast of South America. The warm water replaces the cold water that usually rises from the deep ocean near the coast. El Niño events occur once every two to seven years. They can cause dramatic climate changes around the Pacific Ocean and in other places. In the winter of 1997 and 1998, a strong El Niño current caused droughts in Asia and Brazil, heavy rains and floods in California and Peru, and Tornadoes in Florida and other parts of the southeastern United States. Scientists have looked for clues and warnings to help predict the return of El Niño. One signal is rising surface temperatures in the tropical part of the Pacific Ocean. Using data gathered during past El Niño events, scientists were able to predict many of the results of the 1997-1998 El Niño. 1 Name________________________________________________ Date _____________ Hour____________ Table_______ Reading Weather Maps A weather map is a “snapshot” of conditions at a particular time over a large area. There are many different types of weather maps. Television forecasters often present maps generated by computers from radar information. Weather Service Maps Data from more than 300 local weather stations all over the country are assembled into weather maps at the National Weather Service. The weather map here has been simplified. 2 Name________________________________________________ Date _____________ Hour____________ Table_______ On some weather maps, you see curved lines. These lines connect places where certain conditions— temperature or air pressure—are the same. Isobars are lines joining places on the map that have the same air pressure. (Iso means “equal” and bar means “pressure.”) The numbers on the isobars are the pressure readings. Air pressure readings may be given in inches of mercury or in millibars or both. Isotherms are lines joining places that have the same temperature. The isotherm may be labeled with the temperature in degrees Fahrenheit, degrees Celsius, or both. Newspaper Weather Maps Maps in newspapers are simplified versions of maps produced by the National Weather Service. Exploring Newspaper Weather Maps shows a typical newspaper weather map. From what you have learned in this packet and your book, you can probably interpret most of the symbols on this map. Standard symbols on weather maps show fronts, areas of high and low pressure, types of precipitation, and temperatures. Note that the high and low temperatures are given in degrees Fahrenheit instead of Celsius. The maps here show the path of a winter storm. If you study maps carefully, you can track this storm and its effects. With practice, you can use information from weather maps to help you predict the weather in your area. The Butterfly Effect Even with current technology, weather forecasting is tricky. The main reason is that weather patterns do not follow an orderly, step-by-step process. A forecast for the weather six days from now is based on forecasts for all the days between now and then. A small change in the weather today can mean a larger change in the weather a week later! This is the so-called “butterfly effect.” The name refers to the scientist’s suggestion that even the flapping of butterfly’s wings causes a tiny disturbance in the atmosphere. This tiny event might cause a larger disturbance that could—eventually—grow into a hurricane. 3 Name________________________________________________ Date _____________ Hour____________ Table_______ Weather Instruments Anemometer – An anemometer measures the speed of the wind. The most familiar type of anemometer is the cup anemometer, invented by Dr. John Thomas Romney Robinson in 1846. Thermometer – A thermometer measures temperature. There are many different types of thermometers. Galileo often is credited with inventing the thermometer, but actually he created a thermoscope, a device that could measure the change in temperature (up or down) but not the temperature itself. Gabriel Fahrenheit created the cup anemometer mercury thermometer, Shown at left, a Galileo therwhich many people use mometer; at right, a modern today, in 1714. mercury thermometer. Fahrenheit also created the Fahrenheit scale for Below is a sling psychrometer. measuring temperature, which is still used today. Anders Celsius devised the Celsius scale in 1742. Hygrometer/Psychrometer A hygrometer or psychrometer is a device used to measure humidity. One type of hygrometer is a sling psychrometer. A sling psychrometer has two thermometers (one with a wet bulb and one dry) attached to a handle or length of rope. The sling psychrometer measures by being spun around in the air for a few minutes. The changes between the wet bulb and dry bulb indicate humidity. Rain Gauge – A rain gauge is used to measure precipitation, or the amount of liquid (including snow and sleet) that falls in a certain period of time. Rain gauges can only indicate rainfall in a local area. They make use of bucket, graduate cylinders, and other capturing devices. Barometer – A barometer measures air pressure. There are several types of barometers, some use water to measure air pressure and others use mercury. An aneroid barometer uses an aneroid cell that measures by expanding and contracting in reaction to small air pressure changes. Evangelista Torricelli, a student of Galileo Galilei, devised the first barometer of this type in 1643. Above is a sailor’s barometer; right, is a close-up photo showing the barometer dial. Wind Vane- A wind vane, also called a weather vane, is a tool for measuring wind direction and was probably one of the first weather instruments ever used. To determine wind direction, a wind vane spins and points in the direction from which the wind is coming and generally has two parts, or ends: one that is usually shaped like an arrow and turns into the wind and one end that is wider so that it catches the breeze. The arrow will point to the direction the wind is blowing from so if it is pointing to the east, it means the wind is coming from the east and is called an east wind Nephoscope- is instrument for measuring the altitude, direction, and velocity of clouds. It uses radio waves that bounce back and forth. 4 ACMP ©2006-2008 UAF Geophysical Institute Name________________________________________________ Date _____________ Hour____________ Table_______ "Weather Or Not?" Part A: Meteorologists use the information gathered from weather instruments to create weather maps. They use a set of internationally accepted symbols to represent factors such as barometric pressure, wind speed and direction, and temperature. Label each of the following weather map symbols with what they represent. Use page 2 of this packet and the weather symbol page in the resource page in the back of your book. Part B: When symbols are plotted on a map they are often combined to show the readings of many instruments at one of the several weather stations that help meteorologists forecast weather around the world. (see page 2 of this packet) Answer the following questions using the weather station pictured here. 1. What is the temperature at this weather station? __________________ F 2. What is the wind speed? _________________ mph (miles per hour) 3. Which way is the wind blowing? _____________________ 4. What is the air pressure? ___________________ millibars 5. What percent of the sky is covered by clouds? ______________________ % 6. What type of precipitation (if any) is falling? _________________________ 5 Name________________________________________________ Date _____________ Hour____________ Table_______ Part C: Information from all weather stations is plotted on a map, often by computers. Meteorologists then use this information and the information from the past several days to predict future weather. Use the map on page 2 of this packet to fill in the chart below. Don’t forget your units!!! (Air pressure is labeled on the isobars. Isobars are the lines joining places on the map having the same air pressure.) CITY Air Pressure Temperature Cloud Cover Wind Velocity Wind Direction Seattle, WA Denver, CO OKC, OK New Orleans, LA Boston, MA Part D: Humidity “Our hot sticky weather will continue today with a relative humidity of 83%.” Relative humidity is the amount of water vapor that the air can hold at a certain temperature. A relative humidity of 90% is very humid and uncomfortable. Relative humidity is measured with a hygrometer/psychrometer. If the humidity is low, the water on the wet bulb thermometer will evaporate and cool the thermometer. By finding the difference between the temperatures on both the dry and wet bulbs, and using a chart, the relative humidity can be determined. The following data was recorded over a period of one week. Use the table to find the relative humidity. 6 Name________________________________________________ Date _____________ Hour____________ Table_______ Part E: Label the picture of each weather instrument with the correct name. Use the names listed above. A B C D E G F I H J 7 Name________________________________________________ Date _____________ Hour____________ Table_______ The Wind Chill Factor Part F: Wind chill is a frequently misunderstood term. It is not actually a temperature scale but a measurement of heat loss. Here's how it works: The basic law of thermodynamics says that any object warmer than its surroundings will lose heat. Normally we have an invisible layer of "still" air on the surface of our skin that acts like a blanket of insulation and slows our loss of body heat. Blowing wind reduces this insulating layer of warm air next to our skin and increases our rate of heat loss. The faster the wind blows, the more quickly we lose heat. It's one of the major reasons we feel cool when we stand in front of a fan in the summer (the other reason is evaporation, but that's another story). The wind chill factor becomes critical when the air temperature drops below the freezing point. If wind is taking away heat faster than our bodies can replace it, we'll end up with a nasty case of frostbite. (Frostbite occurs when tissue freezes and dies). The danger of frostbite increases sharply as the air temperature falls and the wind speed climbs. The combined heat loss from wind and low temperatures is called the wind chill factor. For example: An air temperature of 20º F when combined with winds of 15 MPH results in a heat loss rate equivalent to sitting in a freezer at 18 below zero. Brrrrr. To use the chart you'll need to know two things. First: the actual temperature and secondly, a good guess at the wind speed. Find your wind speed in the left-hand column and then read across the row until you find the column that comes closest to matching the actual air temperature (listed in the first row of numbers across the top of the chart). The number you find in the box at the intersection of the wind speed row and the temperature column is the wind chill factor. The following data was collected. Use the data and the chart to fill in the in the wind chill. Day Wind Speed Temperature Sunday 5 km/hr 50° Monday 15 km/hr 30° Tuesday 10 km/hr 40° Wednesday <4 km/hr 0° Thursday 5 km/hr -10° Friday 20 km/hr 10° Saturday 25 km/hr -10° Wind Chill 8 Name________________________________________________ Date _____________ Hour____________ Table_______ Part G: Flash Boom FLASH- a bolt of lightning brightens the sky. You slowly count to 15 and then – BOOM—thunder! With this information, you are able to estimate how far the lightning is from you. Lightning and thunder occur at approximately the same time, but you see the lightning before you hear the thunder. That is because light travels much faster than sound. On a typical warm summer day, sound travels one kilometer in three seconds. How far away is the storm if you count 15 seconds? Follow these steps to find out. 1. Time the FLASH to Boom in seconds. 2. Divide the seconds by 3. (3 km/sec) If your answer has a remainder, you may round off the nearest whole number.) 3. Your answer is in kilometers. Matt timed eight FLASH-BOOMs in a storm as it approached and passed. Using Matt’s data, find the distance of the storm with each passing FLASH-BOOM. Circle the time and distance when the storm was the closest. Number Time 1 63 seconds 2 48 seconds 3 24 seconds 4 18 seconds 5 9 seconds 6 3 seconds 7 12 seconds 8 27 seconds Distance (km) Part H: Weather Puzzle ACROSS 3 The boundary where air masses of different temperatures or moisture meet and do not mix 5 An electrical discharge between parts of a cloud or between a cloud and the ground 7 Large swirling, tropical weather system; considered the most powerful storm on Earth 9 Large body of air with similar temperature and moisture throughout 10 A scientist who studies weather patterns 11 An instrument for measuring temperature 12 An instrument for measuring the pressure of the atmosphere DOWN 1 Winter storm with winds at least 51 km/hr and a temperature of negative twelve degrees Celsius or below 2 Weather system that produces large winds, hail, heavy rain, lightning, and thunder 4 Rotating funnel-shaped cloud that reaches down from storm clouds; causes major destruction to objects at Earth's surface 6 An instrument used to measure the force and speed of the wind 8 The sound that occurs as air expands rapidly when lightning occurs 9 Name________________________________________________ Date _____________ Hour____________ Table_______ Weather Forecast Complete this activity on the map that of the United States On the map, draw the symbols that represent the following scenario: 1. There is a cold front moving southeast through Missouri, Oklahoma, Arkansas and Texas; 2. There is a low pressure system over California and Nevada; 3. There is a thunder storm on the east coast from Massachusetts to Maine; 4. The isobar that includes Wyoming, North and South Dakota, Minnesota, and into Canada has a reading of 1016 millibars. The National Weather station in Norman is reading the following: (draw the weather station) 1. 75% cloud cover, 2. 71 °F, 3. Wind velocity of 22 mph blowing towards the southeast. 10
