Bio 292 Population Ecology
advertisement
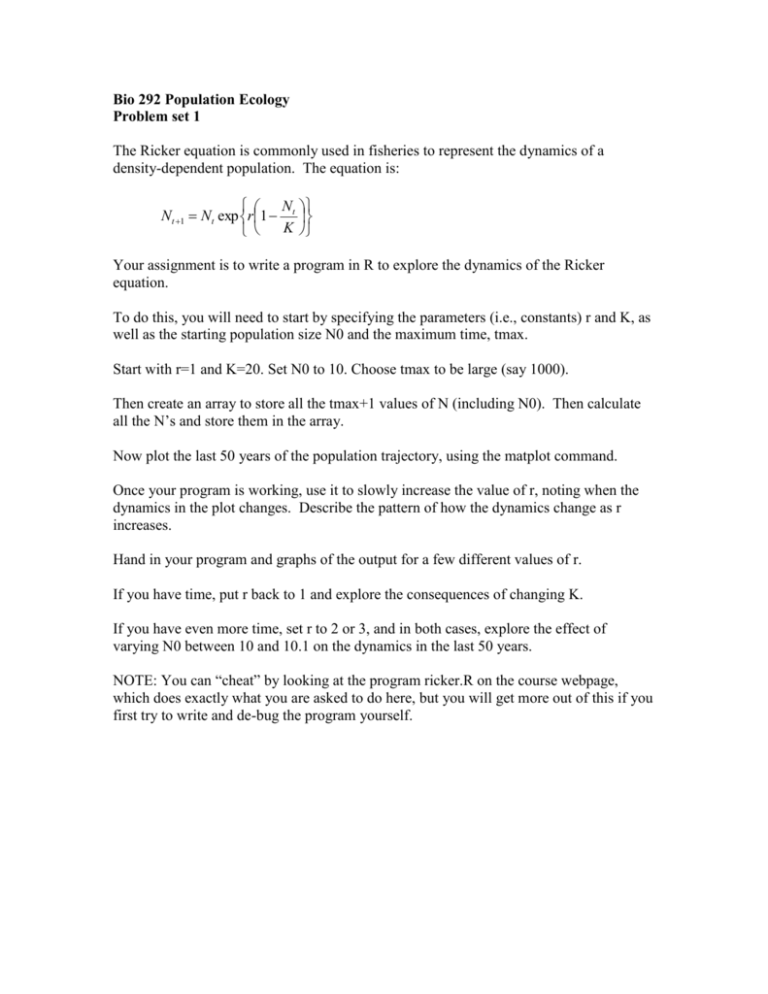
Bio 292 Population Ecology Problem set 1 The Ricker equation is commonly used in fisheries to represent the dynamics of a density-dependent population. The equation is: N Nt 1 N t exp r 1 t K Your assignment is to write a program in R to explore the dynamics of the Ricker equation. To do this, you will need to start by specifying the parameters (i.e., constants) r and K, as well as the starting population size N0 and the maximum time, tmax. Start with r=1 and K=20. Set N0 to 10. Choose tmax to be large (say 1000). Then create an array to store all the tmax+1 values of N (including N0). Then calculate all the N’s and store them in the array. Now plot the last 50 years of the population trajectory, using the matplot command. Once your program is working, use it to slowly increase the value of r, noting when the dynamics in the plot changes. Describe the pattern of how the dynamics change as r increases. Hand in your program and graphs of the output for a few different values of r. If you have time, put r back to 1 and explore the consequences of changing K. If you have even more time, set r to 2 or 3, and in both cases, explore the effect of varying N0 between 10 and 10.1 on the dynamics in the last 50 years. NOTE: You can “cheat” by looking at the program ricker.R on the course webpage, which does exactly what you are asked to do here, but you will get more out of this if you first try to write and de-bug the program yourself.

