04-05 Lab buffers, titration Lab pH buffers titrate 1415_2
advertisement
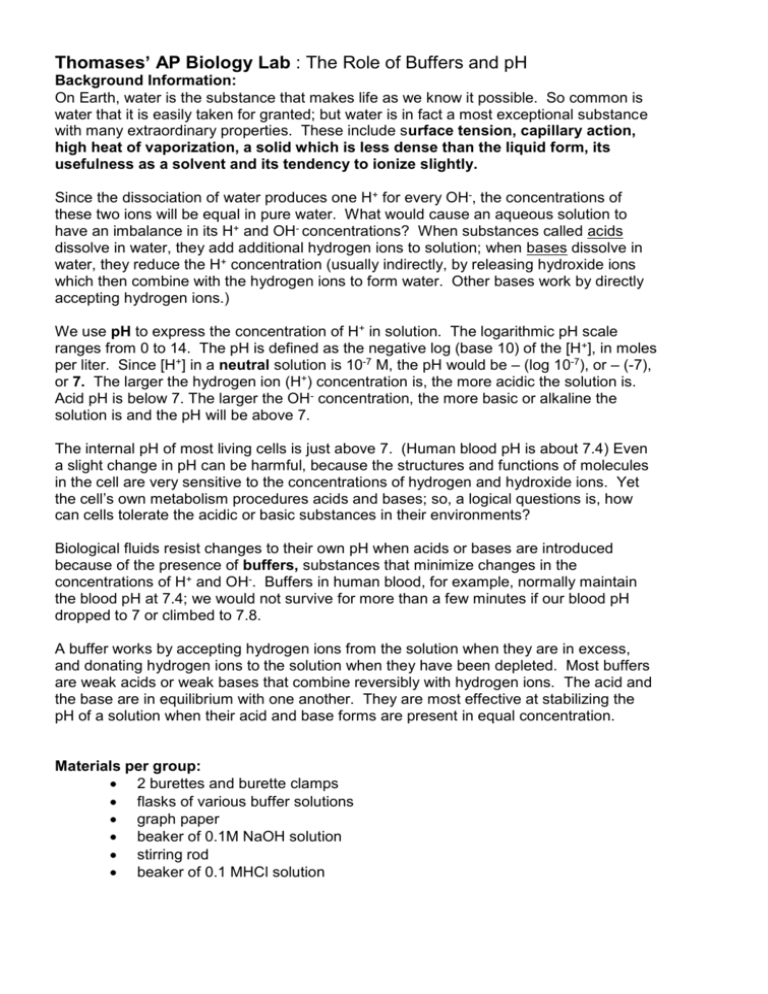
Thomases’ AP Biology Lab : The Role of Buffers and pH Background Information: On Earth, water is the substance that makes life as we know it possible. So common is water that it is easily taken for granted; but water is in fact a most exceptional substance with many extraordinary properties. These include surface tension, capillary action, high heat of vaporization, a solid which is less dense than the liquid form, its usefulness as a solvent and its tendency to ionize slightly. Since the dissociation of water produces one H+ for every OH-, the concentrations of these two ions will be equal in pure water. What would cause an aqueous solution to have an imbalance in its H+ and OH- concentrations? When substances called acids dissolve in water, they add additional hydrogen ions to solution; when bases dissolve in water, they reduce the H+ concentration (usually indirectly, by releasing hydroxide ions which then combine with the hydrogen ions to form water. Other bases work by directly accepting hydrogen ions.) We use pH to express the concentration of H+ in solution. The logarithmic pH scale ranges from 0 to 14. The pH is defined as the negative log (base 10) of the [H +], in moles per liter. Since [H+] in a neutral solution is 10-7 M, the pH would be – (log 10-7), or – (-7), or 7. The larger the hydrogen ion (H+) concentration is, the more acidic the solution is. Acid pH is below 7. The larger the OH- concentration, the more basic or alkaline the solution is and the pH will be above 7. The internal pH of most living cells is just above 7. (Human blood pH is about 7.4) Even a slight change in pH can be harmful, because the structures and functions of molecules in the cell are very sensitive to the concentrations of hydrogen and hydroxide ions. Yet the cell’s own metabolism procedures acids and bases; so, a logical questions is, how can cells tolerate the acidic or basic substances in their environments? Biological fluids resist changes to their own pH when acids or bases are introduced because of the presence of buffers, substances that minimize changes in the concentrations of H+ and OH-. Buffers in human blood, for example, normally maintain the blood pH at 7.4; we would not survive for more than a few minutes if our blood pH dropped to 7 or climbed to 7.8. A buffer works by accepting hydrogen ions from the solution when they are in excess, and donating hydrogen ions to the solution when they have been depleted. Most buffers are weak acids or weak bases that combine reversibly with hydrogen ions. The acid and the base are in equilibrium with one another. They are most effective at stabilizing the pH of a solution when their acid and base forms are present in equal concentration. Materials per group: 2 burettes and burette clamps flasks of various buffer solutions graph paper beaker of 0.1M NaOH solution stirring rod beaker of 0.1 MHCl solution pH paper or probes ring stand flask of distilled water 125 mL Erlenmeyer flask Graduated cylinder (100 mL) pH paper or probe Procedure: 1. Set up your two burettes, and run a little water through them. 2. With the stop cock closed, pour 15 ml of 0.1 acid-water solution (.1M HCl) into one of the burettes; pour 15 ml of the base (0.1 NaOH) into the other. 3. Distilled water & acid. a. Check purity of glassware b. Pour 20 ml distilled water into a 125 ml Erlenmeyer flask. c. Record its pH at time 0. d. Now begin to get pH data: add acid with a burette, 0.5 ml at a time. Swirl the flask and record the pH (determined by full range pH paper or by pH meter) after each increment has been added. e. When you have added a total volume of 5 mLs acid, stop. Flush the solution in the flask down the sink with plenty of water. Wash and dry the glassware. 4. Buffer & Acid. Repeat step #3 but put the buffer into the flask instead of distilled water and add the acid. 5. Distilled water & base – repeat step # 3 but put distilled water in the clean flask and add the base. 6. Buffer solution & base. Repeat step #3 but put the buffer solution into the flask and add the base. Results 1. Make 2 data tables, one for acid and acid plus buffer. The other is for base and base plus buffer. 2. Graphs the two data tables ON ONE GRAPH. To construct a buffer capacity curve, write the pH scale on the vertical axis (this is the dependent variable), and write the mLs acid or base added on the horizontal axis (this is the independent variable). Directly compare the distilled water vs. buffer solution curves by having them appear on the same graphs (for either acid addition or base addition). Analysis – this lab will be discussed in class.
