Teacher Handout - Molecular Sequence Conservation
advertisement
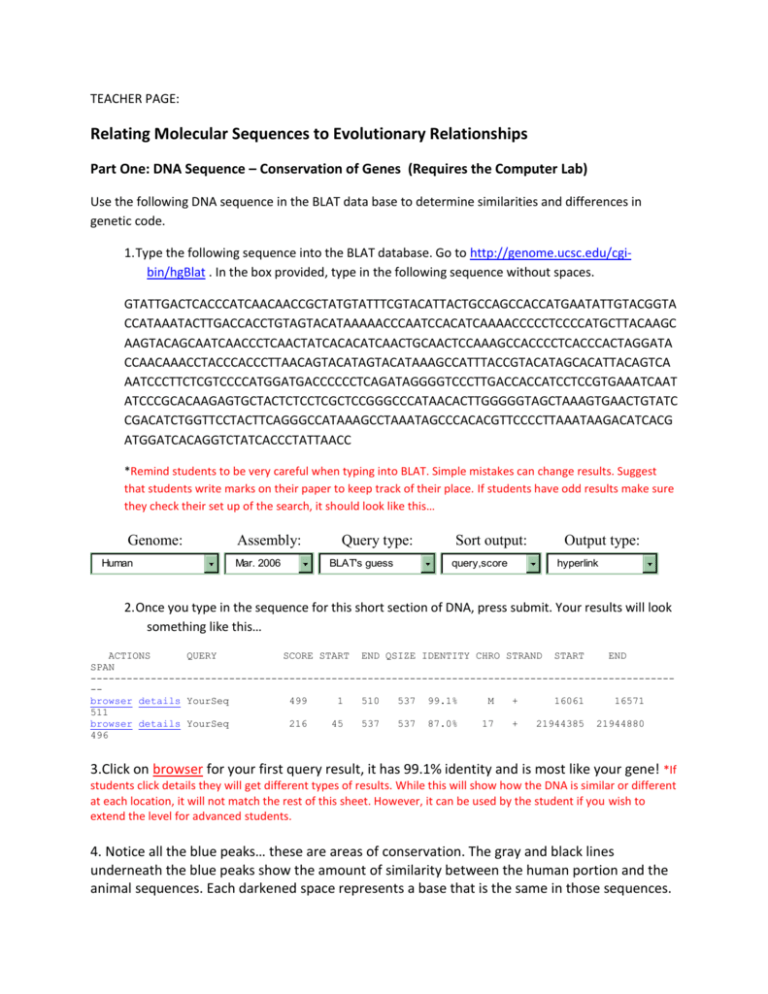
TEACHER PAGE: Relating Molecular Sequences to Evolutionary Relationships Part One: DNA Sequence – Conservation of Genes (Requires the Computer Lab) Use the following DNA sequence in the BLAT data base to determine similarities and differences in genetic code. 1. Type the following sequence into the BLAT database. Go to http://genome.ucsc.edu/cgibin/hgBlat . In the box provided, type in the following sequence without spaces. GTATTGACTCACCCATCAACAACCGCTATGTATTTCGTACATTACTGCCAGCCACCATGAATATTGTACGGTA CCATAAATACTTGACCACCTGTAGTACATAAAAACCCAATCCACATCAAAACCCCCTCCCCATGCTTACAAGC AAGTACAGCAATCAACCCTCAACTATCACACATCAACTGCAACTCCAAAGCCACCCCTCACCCACTAGGATA CCAACAAACCTACCCACCCTTAACAGTACATAGTACATAAAGCCATTTACCGTACATAGCACATTACAGTCA AATCCCTTCTCGTCCCCATGGATGACCCCCCTCAGATAGGGGTCCCTTGACCACCATCCTCCGTGAAATCAAT ATCCCGCACAAGAGTGCTACTCTCCTCGCTCCGGGCCCATAACACTTGGGGGTAGCTAAAGTGAACTGTATC CGACATCTGGTTCCTACTTCAGGGCCATAAAGCCTAAATAGCCCACACGTTCCCCTTAAATAAGACATCACG ATGGATCACAGGTCTATCACCCTATTAACC *Remind students to be very careful when typing into BLAT. Simple mistakes can change results. Suggest that students write marks on their paper to keep track of their place. If students have odd results make sure they check their set up of the search, it should look like this… Genome: Human Assembly: Mar. 2006 Query type: BLAT's guess Sort output: query,score Output type: hyperlink 2. Once you type in the sequence for this short section of DNA, press submit. Your results will look something like this… ACTIONS QUERY SCORE START END QSIZE IDENTITY CHRO STRAND START END SPAN -------------------------------------------------------------------------------------------------browser details YourSeq 499 1 510 537 99.1% M + 16061 16571 511 browser details YourSeq 216 45 537 537 87.0% 17 + 21944385 21944880 496 3.Click on browser for your first query result, it has 99.1% identity and is most like your gene! *If students click details they will get different types of results. While this will show how the DNA is similar or different at each location, it will not match the rest of this sheet. However, it can be used by the student if you wish to extend the level for advanced students. 4. Notice all the blue peaks… these are areas of conservation. The gray and black lines underneath the blue peaks show the amount of similarity between the human portion and the animal sequences. Each darkened space represents a base that is the same in those sequences. 5. Look at Mouse, Dog, Platypus, Chicken and Stickleback to answer the following questions. Questions: 1. Using the scale at the top of the chart, which section of the gene is most similar among mammals? 16400-16550 2. List the animals in order of MOST like the human sequence to the one least like the human sequence. Mouse, Platypus, Dog, Stickleback, Chicken 3. Notice there is no results for the Rhesus Monkey or the Lizard. Why might this data be missing? Answers will vary – data not available, different families then the human, might not have the gene 4. Why could there be different reasons for these two species to not have data in this location? (HINT: How are these animals similar or different to humans?) Should discuss that while monkeys should have similar DNA but the Lizards may very well NOT have that section of DNA at all. Part Two: Amino Acid Sequence – Conservation of Proteins Use the attached sheet to compare the amino acid sequence for the protein of each of the animals. The three letter codes are abbreviations for the amino acids. 1. Compare the amino acid sequence of Cytochrome c for each species to the sequence of the human. Determine the number of differences between each species. Species Horse Chicken Tuna Frog Shark Turtle Monkey Rabbit # Differences from the Human Cytochrome c 6 7 9 8 13 8 2 4 1. According to your analysis of the amino acid sequences, which species listed is most closely related to humans? Monkey 2. Which species is least closely related to humans? Shark Compare the amino acid sequence of hemoglobin for each species to the sequence of the human. Determine the number of differences between each species. Species Chimp Gorilla Monkey Horse # Differences from Human Hemoglobin 0 1 2 4 1. List the four vertebrate sequences in descending order according to how similar they are to human hemoglobin. (most to least) Chimp, Gorilla, Monkey, Horse 2. According to your analysis of the amino acid sequences, which species listed is most closely related to humans? Chimp 3. Which species is least closely related to humans? Horse 4. What is the difference between gorilla and human hemoglobin?One amino acid different 5. What might have been responsible for this change (from question 4)?Mutation Part Three: Analysis Questions Use information you have gathered from both of these activities to answer the following questions. 1. How is this method (using sequence) different from other methods used to determine evolutionary relationships? This looks at the code of the organism where other forms look at physical structure and expression of the code in the organism. 2. If the amino acid sequences are similar between two species, why would you expect their DNA to be similar? DNA sequence determines Amino Acid sequence through transcription and translation. 3. Proteins are sometimes called “biological clocks”. Why might we be able to use protein (think sequences) to determine relative age of organisms? Organisms more closely related have diverged more recently from each other. This means the organisms that are further apart have an older divergence. This helps us determine a timeline of when organisms diverged, or a “clock”. 4. How do molecular biologists help evolutionary biologist determine relationships among animals? They allow the evolutionary biologist to see the framework sequence and not just the outer phenotype. This can help solidify relationships or break down faulty ones. 5. If you have a section of DNA that shows exact bands of DNA but the organisms do not show the same traits, what can you say is happening? (HINT: Is the sequence changing or is something else happening to the organism?) Answers will vary BUT it should discuss expression of DNA as proteins. Cytochrome c Amino Acid Sequences Horse Gln Ala Pro Phe Thr Thr Asp Lys Asn Lys Gly Ile Thr Lys Glu Glu Thr Leu Met Glu Lys Ala Thr Asn Glu Chicken Gln Ala Glu Phe Ser Thr Asp Lys Asn Lys Gly Ile Thr Gly Glu Asp Thr Leu Met Glu Asp Ala Thr Ser Lys Tuna Gln Ala Glu Tyr Ser Thr Asp Lys Ser Lys Gly Ile Val Asn Asn Asp Thr Leu Met Glu Ser Ala Thr Ser Frog Gln Ala Ala Phe Ser Thr Asp Lys Asn Lys Gly Ile Thr Gly Glu Asp Thr Leu Met Glu Ser Ala Gly Ser Lys Human Gln Ala Pro Tyr Ser Thr Ala Lys Asn Lys Gly Ile Ile Gly Glu Asp Thr Leu Met Glu Lys Ala Thr Asn Glu Shark Gln Ala Gln Phe Ser Thr Asp Lys Ser Lys Gly Ile Thr Gln Gln Glu Thr Leu Arg Ile Lys Thr Ala Ala Ser Turtle Gln Ala Glu Phe Ser Thr Asp Lys Asn Lys Gly Ile Thr Gly Glu Glu Thr Leu Met Glu Asp Ala Thr Ser Lys Monkey Gln Ala Pro Tyr Ser Thr Asp Lys Asn Lys Gly Ile Ile Gly Glu Asp Thr Leu Met Glu Lys Ala Ala Asn Glu Rabbit Gln Ala Tyr Pro Ser Thr Asp Lys Asn Lys Gly Ile Thr Gly Glu Asp Thr Leu Met Glu Lys Ala Thr Asn Glu Hemoglobin Amino Acid Sequence Human Thr Leu Ser Glu Leu His Cys Asp Lys Leu His Val Asp Pro Glu Asn Phe Arg Leu Leu Gly Asn Val Leu Val Csy Val Leu Ala Chimpanzee Thr Leu Ser Glu Leu His Cys Asp Lys Leu His Val Asp Pro Glu Asn Phe Arg Leu Leu Gly Asn Val Leu Val Csy Val Leu Ala Gorilla Thr Leu Ser Glu Leu His Cys Asp Lys Leu His Val Asp Pro Glu Asn Phe Lys Leu Leu Gly Asn Val Leu Val Csy Val Leu Ala Monkey Gln Leu Ser Glu Leu His Cys Asp Lys Leu His Val Asp Pro Glu Asn Phe Lys Leu Leu Gly Asn Val Leu Val Csy Val Leu Ala Horse Thr Leu Ser Glu Leu His Cys Asp Lys Leu His Val Asp Pro Glu Asn Phe Arg Leu Leu Gly Asn Val Leu Ala Leu Val Val Ala His His His His Arg
