Causal Loop Diagrams
advertisement
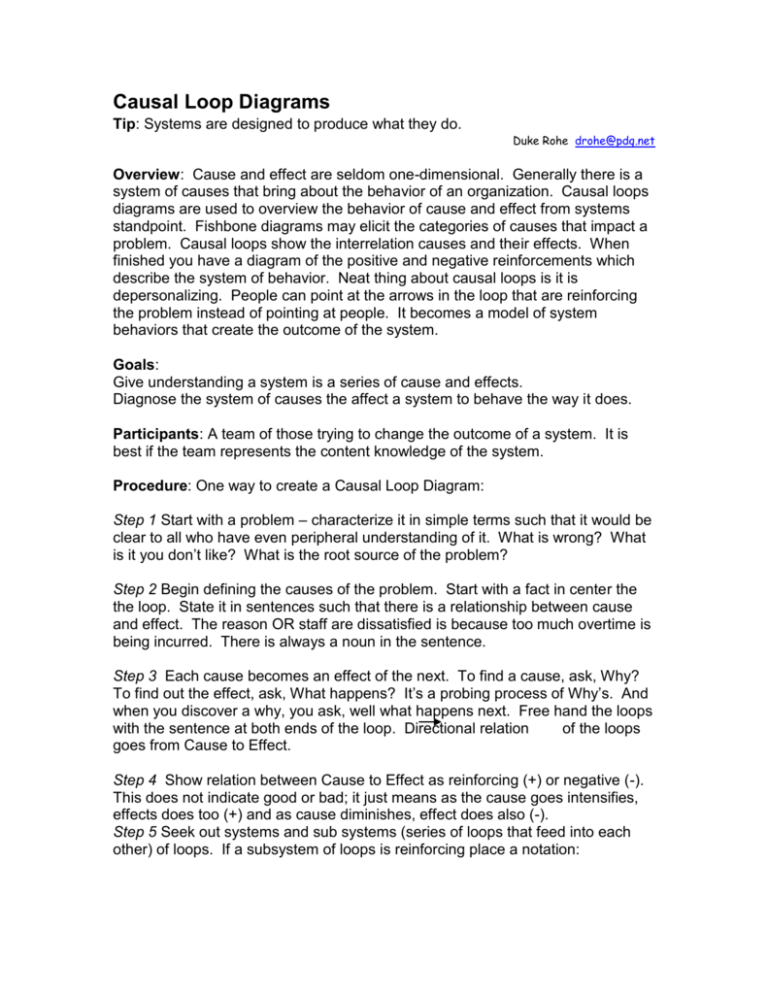
Causal Loop Diagrams Tip: Systems are designed to produce what they do. Duke Rohe drohe@pdq.net Overview: Cause and effect are seldom one-dimensional. Generally there is a system of causes that bring about the behavior of an organization. Causal loops diagrams are used to overview the behavior of cause and effect from systems standpoint. Fishbone diagrams may elicit the categories of causes that impact a problem. Causal loops show the interrelation causes and their effects. When finished you have a diagram of the positive and negative reinforcements which describe the system of behavior. Neat thing about causal loops is it is depersonalizing. People can point at the arrows in the loop that are reinforcing the problem instead of pointing at people. It becomes a model of system behaviors that create the outcome of the system. Goals: Give understanding a system is a series of cause and effects. Diagnose the system of causes the affect a system to behave the way it does. Participants: A team of those trying to change the outcome of a system. It is best if the team represents the content knowledge of the system. Procedure: One way to create a Causal Loop Diagram: Step 1 Start with a problem – characterize it in simple terms such that it would be clear to all who have even peripheral understanding of it. What is wrong? What is it you don’t like? What is the root source of the problem? Step 2 Begin defining the causes of the problem. Start with a fact in center the the loop. State it in sentences such that there is a relationship between cause and effect. The reason OR staff are dissatisfied is because too much overtime is being incurred. There is always a noun in the sentence. Step 3 Each cause becomes an effect of the next. To find a cause, ask, Why? To find out the effect, ask, What happens? It’s a probing process of Why’s. And when you discover a why, you ask, well what happens next. Free hand the loops with the sentence at both ends of the loop. Directional relation of the loops goes from Cause to Effect. Step 4 Show relation between Cause to Effect as reinforcing (+) or negative (-). This does not indicate good or bad; it just means as the cause goes intensifies, effects does too (+) and as cause diminishes, effect does also (-). Step 5 Seek out systems and sub systems (series of loops that feed into each other) of loops. If a subsystem of loops is reinforcing place a notation: Step 6 Distinguish between perceived (assumptions) and real facts. If possible graph over time to better characterize them. Step 7 Revisit and refine causes and their effects. Step 8 To begin reducing an effect of a cause, take a loop out and ask: if this effect were ‘fixed’ or did not matter what could be done to lessen its impact on the loop. This entertains possible solutions. By lessening or eliminating any arrow in the loop, you make an impact on the overall behavior of the system. If you are stuck on how to lessen an impact of the loop, imagine having a conversation a year from now and saying “I overcame this by…..) Special Reminder: What I like most about Causal Loop Diagrams is they illustrate that our organizations are human nature on mass scale. And by understanding the assumptions behind its actions allows one to make profound change. Causal Loop Diagram on UnForgiveness Perceived Negative Action Intervention + + Positive Correlation or Reinforcement (not right/wrong or good/bad) - Negative Correlation or Reinforcement (not right/wrong or good/bad) Expectation not met Accumulate + - Bitterness Forgive Self Esteem + + Blame + Flood of Emotion + Reaction + Feeling Vulnerable + + + + Ownership of Feelings

