Lab 3 GEOL 195-Fall 2007
advertisement
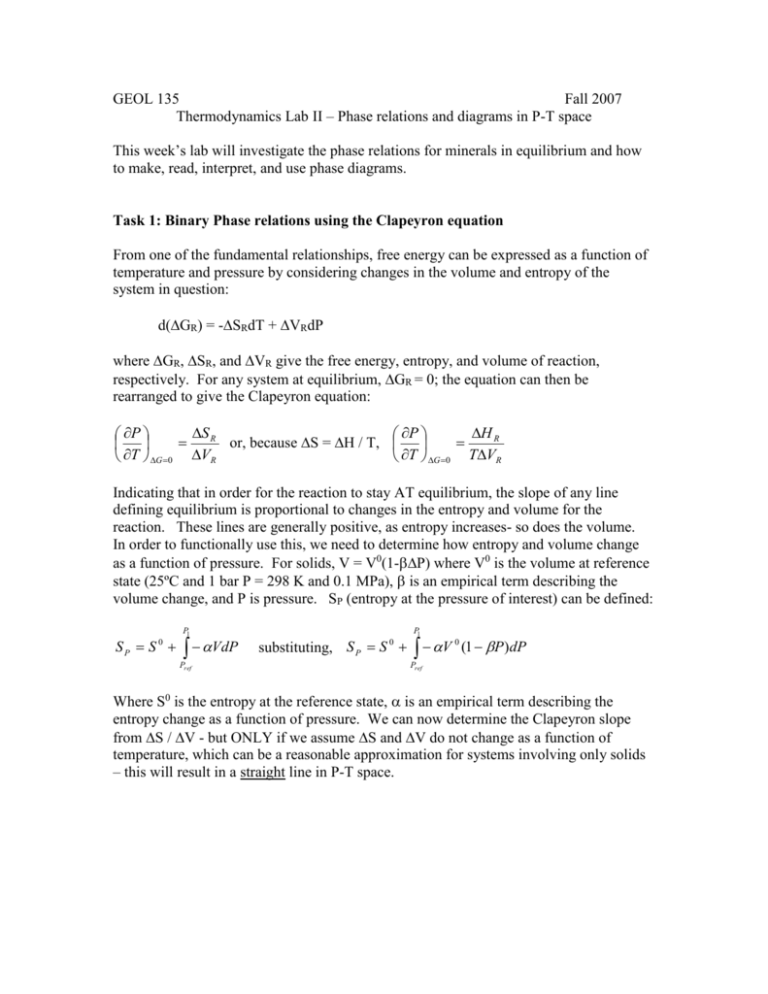
GEOL 135 Fall 2007 Thermodynamics Lab II – Phase relations and diagrams in P-T space This week’s lab will investigate the phase relations for minerals in equilibrium and how to make, read, interpret, and use phase diagrams. Task 1: Binary Phase relations using the Clapeyron equation From one of the fundamental relationships, free energy can be expressed as a function of temperature and pressure by considering changes in the volume and entropy of the system in question: d(GR) = -SRdT + VRdP where GR, SR, and VR give the free energy, entropy, and volume of reaction, respectively. For any system at equilibrium, GR = 0; the equation can then be rearranged to give the Clapeyron equation: S R H R P P or, because S = H / T, T G 0 VR T G 0 TVR Indicating that in order for the reaction to stay AT equilibrium, the slope of any line defining equilibrium is proportional to changes in the entropy and volume for the reaction. These lines are generally positive, as entropy increases- so does the volume. In order to functionally use this, we need to determine how entropy and volume change as a function of pressure. For solids, V = V0(1-P) where V0 is the volume at reference state (25ºC and 1 bar P = 298 K and 0.1 MPa), is an empirical term describing the volume change, and P is pressure. SP (entropy at the pressure of interest) can be defined: SP S 0 P1 VdP Pref substituting, S P S 0 P1 V 0 (1 P)dP Pref Where S0 is the entropy at the reference state, is an empirical term describing the entropy change as a function of pressure. We can now determine the Clapeyron slope from S / V - but ONLY if we assume S and V do not change as a function of temperature, which can be a reasonable approximation for systems involving only solids – this will result in a straight line in P-T space. For the equilibrium between Kyanite and Andalusite (both of the formula Al2SiO5), determine the equilibrium temperature at 1 bar pressure as the starting point for our phase diagram. Mineral Kyanite Andalusite fH0 (KJ/mol) -2594.29 -2590.27 fG0 9KJ/mol) -2443.88 -2442.66 S0 (J mol-1 K-1) 83.81 93.22 V0 (cm3 mol-1) 44.09 51.53 Step1: Integrate the following partial differential: GR 0 0 T S R P Step 2: Now assume that SR0 is constant with respect to T (allowing you to bring it outside the integral) – to find an expression relating the free energy of the reaction at equilibrium (=0), free energy at standard state, SR0, and the temperature change between standard state (=298K) and the equilibrium T (which is your unknown). Step 3: use the data in Table 1 to solve for the equilibrium temperature. Step 4: Now let’s use the Clapeyron relationship to determine the slope of the line in P-T space and plot that below on the graph. P (bar) T (K) Task 2: P-T diagrams interpretation: SiO2 diagram Gibbs Phase rule can be stated: F=C–p+2 Where p is the number of phases, defined as the number of different types of mechanically separable phases of the system; C is the number of components, defined as the minimum number of components that must be specified to define the composition of every phase in the system; and F is the ‘degrees of freedom’, defined as the number of intensive parameters that can be changed independently without changing the phases at equilibrium. Consider the following system and answer the following questions: 1. What is F at 2 GPa and 600ºC? Make an x at that spot. 2. As the temperature increases at 2 GPa, explain what happens at this temperature and determine F for this temperature, make a square at that spot. 3. What is F for a rock that containsquartz, -quartz, and coesite? 4. Use the Clapeyron equation to infer if quartz or -quartz has the larger molar volume – assuming the reaction -quartz -quartz has a SR>0 5. Speculate on why the lines in the Al2SiO5 diagram were straight whereas some of the lines in the SiO2 diagram are curved Task 3 – Phase relations and conditions in Vermont using a geologic map Using the Al2SiO5 P-T diagram you constructed, locate places in Vermont containing 2 degrees of freedom on this diagram and where the smallest circle you could draw containing all 3 phases would be (defining then the triple point). http://www.anr.state.vt.us/dec/geo/centennialmap/smrgttoprgt.jpg
