LAB: Locating Earthquake Epicenters
advertisement
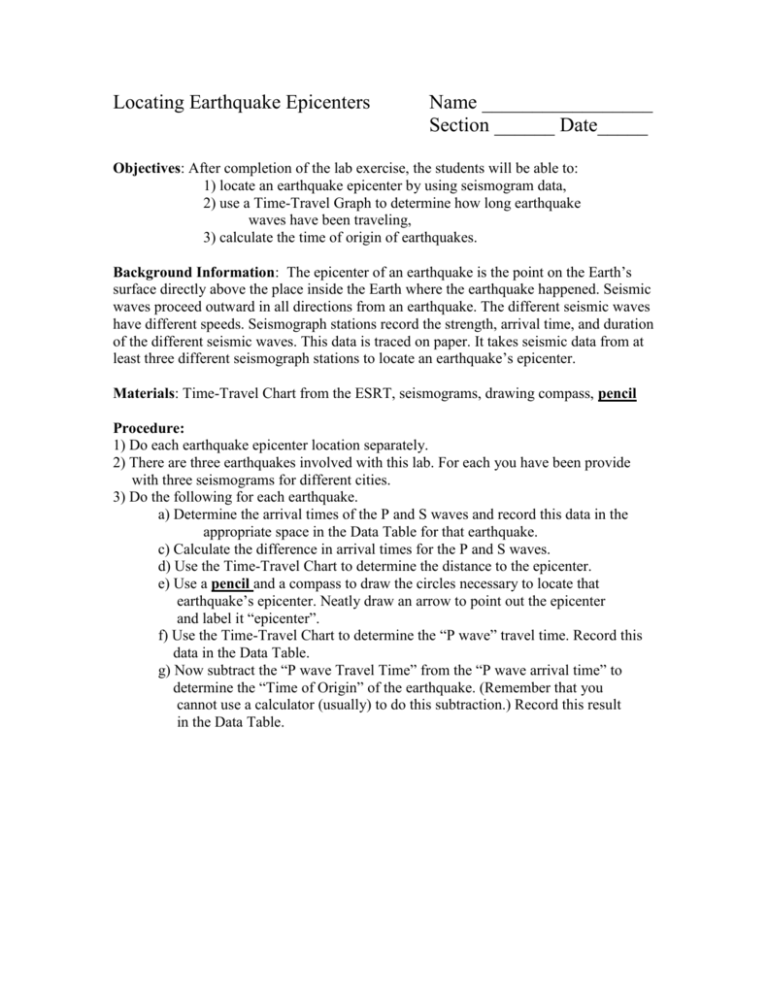
Locating Earthquake Epicenters Name _________________ Section ______ Date_____ Objectives: After completion of the lab exercise, the students will be able to: 1) locate an earthquake epicenter by using seismogram data, 2) use a Time-Travel Graph to determine how long earthquake waves have been traveling, 3) calculate the time of origin of earthquakes. Background Information: The epicenter of an earthquake is the point on the Earth’s surface directly above the place inside the Earth where the earthquake happened. Seismic waves proceed outward in all directions from an earthquake. The different seismic waves have different speeds. Seismograph stations record the strength, arrival time, and duration of the different seismic waves. This data is traced on paper. It takes seismic data from at least three different seismograph stations to locate an earthquake’s epicenter. Materials: Time-Travel Chart from the ESRT, seismograms, drawing compass, pencil Procedure: 1) Do each earthquake epicenter location separately. 2) There are three earthquakes involved with this lab. For each you have been provide with three seismograms for different cities. 3) Do the following for each earthquake. a) Determine the arrival times of the P and S waves and record this data in the appropriate space in the Data Table for that earthquake. c) Calculate the difference in arrival times for the P and S waves. d) Use the Time-Travel Chart to determine the distance to the epicenter. e) Use a pencil and a compass to draw the circles necessary to locate that earthquake’s epicenter. Neatly draw an arrow to point out the epicenter and label it “epicenter”. f) Use the Time-Travel Chart to determine the “P wave” travel time. Record this data in the Data Table. g) Now subtract the “P wave Travel Time” from the “P wave arrival time” to determine the “Time of Origin” of the earthquake. (Remember that you cannot use a calculator (usually) to do this subtraction.) Record this result in the Data Table. Seismograph Arrival (clock) Time Station P Wave S Wave Balboa Heights, Panama Boulder, CO Mexico City Mexico Difference in arrival times (min. and sec.) Distance to Epicenter (km) P wave travel time (min. and sec.) Time of Origin (hr. min, sec.) The first seismograph is for BH, Balboa Heights, Panama The second seismograph is for BC, Boulder Colorado, USA The third seismograph is for Mexico City, Mexico Answer these questions for this first set of seismograms. 1) Predict which of these three cities is actually closest to the earthquake epicenter. 2) Give ONE reason for your answer to number one. 3) Which of these three cities might actually have felt the tremors of this earthquake? Explain your answer. Analysis and Conclusions: 1) When a seismograph station is far away from the earthquake epicenter, what do you notice about the distance between the arrival times of the P and S waves? 2) Why can you not determine the location of an epicenter using only two seismograph stations? 3) Why would a seismograph station in a particular city not record any data about some earthquakes? 4) Many third world nations experience more deaths due to earthquakes than industrialized nations. Propose one reason for this. 5) Use your text or the internet and identify one major earthquake that occurred within the last 100 years. Give the following information: a) date and time b) center/ location b i) did the earthquake happen on a plate tectonic boundary? c) magnitude d) deaths or damage 6) List one other reason other than tectonic plates colliding or sliding that may cause an earthquake. 7) List at least 2 emergency procedures that would be necessary during or immediately following an earthquake. If necessary, identify why each would have to be done.

