CB4 Food Activity
advertisement
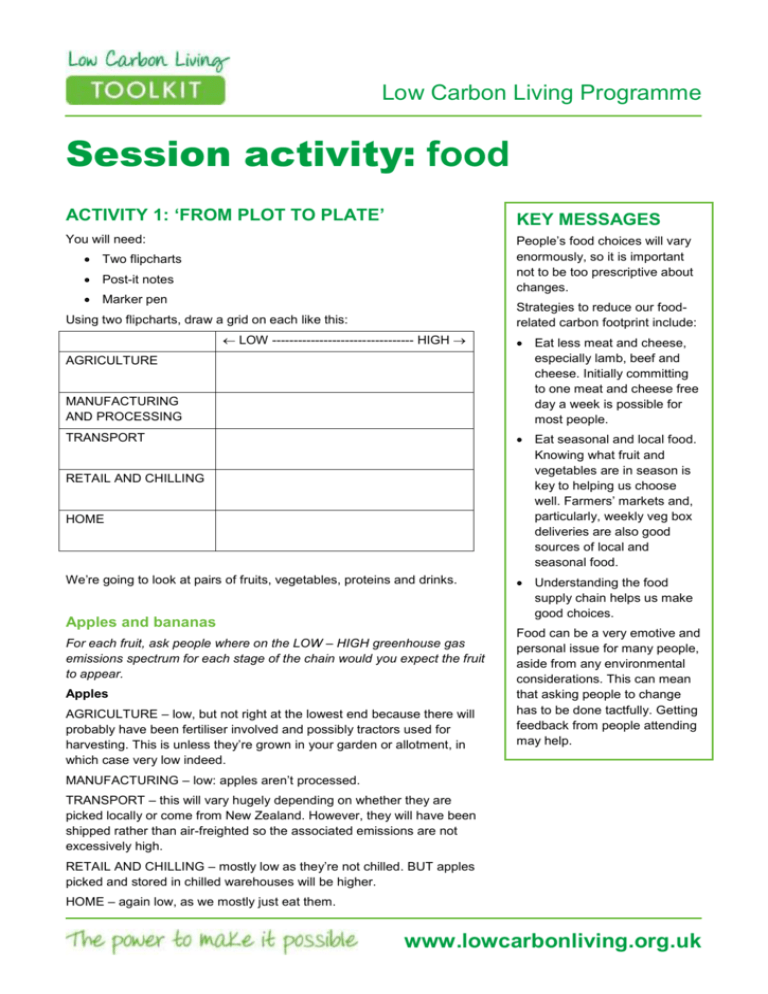
Low Carbon Living Programme Session activity: food ACTIVITY 1: ‘FROM PLOT TO PLATE’ KEY MESSAGES People’s food choices will vary enormously, so it is important not to be too prescriptive about changes. You will need: Two flipcharts Post-it notes Marker pen Strategies to reduce our foodrelated carbon footprint include: Using two flipcharts, draw a grid on each like this: LOW --------------------------------- HIGH AGRICULTURE MANUFACTURING AND PROCESSING Eat less meat and cheese, especially lamb, beef and cheese. Initially committing to one meat and cheese free day a week is possible for most people. Eat seasonal and local food. Knowing what fruit and vegetables are in season is key to helping us choose well. Farmers’ markets and, particularly, weekly veg box deliveries are also good sources of local and seasonal food. TRANSPORT RETAIL AND CHILLING HOME We’re going to look at pairs of fruits, vegetables, proteins and drinks. Apples and bananas For each fruit, ask people where on the LOW – HIGH greenhouse gas emissions spectrum for each stage of the chain would you expect the fruit to appear. Apples AGRICULTURE – low, but not right at the lowest end because there will probably have been fertiliser involved and possibly tractors used for harvesting. This is unless they’re grown in your garden or allotment, in which case very low indeed. Understanding the food supply chain helps us make good choices. Food can be a very emotive and personal issue for many people, aside from any environmental considerations. This can mean that asking people to change has to be done tactfully. Getting feedback from people attending may help. MANUFACTURING – low: apples aren’t processed. TRANSPORT – this will vary hugely depending on whether they are picked locally or come from New Zealand. However, they will have been shipped rather than air-freighted so the associated emissions are not excessively high. RETAIL AND CHILLING – mostly low as they’re not chilled. BUT apples picked and stored in chilled warehouses will be higher. HOME – again low, as we mostly just eat them. www.lowcarbonliving.org.uk Bananas AGRICULTURE – low, but not right at the lowest end because there will probably have been fertiliser involved and possibly tractors used for harvesting. Note that there is no opportunity to grow local bananas! MANUFACTURING AND PROCESSING – low again. TRANSPORT – all bananas are shipped here rather than flown, so around the middle. RETAIL AND CHILLING – low, as they don’t need to be chilled. HOME – low. For comparison, the figures for apples and bananas from How bad are bananas? by Mike Berners Lee are: Apples Bananas 0 CO2e picked in your garden 80g each or 480g CO2e per kg of bananas 10g CO2e local and seasonal 80g CO2e average – that’s 550g per kg of apples 150g CO2e inefficiently produced, shipped and cold-stored If you wanted to add a third fruit then strawberries help to highlight the difference between seasonal, local fruit and that which has been air-freighted or hothouse-grown, out-of season. Strawberries (a punnet) 0 CO2e picked in your garden 150g CO2e local and seasonal – or 600g per kg of strawberries 1.8kg CO2e hothouse or airfreighted – that’s 7.2kg per kg Tomatoes and green beans Tomatoes and green beans are used as an example because they highlight some important issues. Tomato production can be very damaging indeed when grown organically in a hothouse. However, a tomato grown in your garden has virtually no carbon footprint. Tomatoes AGRICULTURE – could range from low to high depending on where and how they are grown. If they are grown in a hothouse then it will be very high – How bad are bananas? suggests 50kg per kg for hothouse, organic, onthe-vine cherry tomatoes. Tomatoes are in season in the UK from August to September/October, so it makes sense to buy UK tomatoes during these months. At other times, Spanish tomatoes generally have a lower carbon footprint, despite having travelled further. MANUFACTURING AND PROCESSING – low again. TRANSPORT – will depend on how far, but generally will come by road rather than air-freighted. RETAIL AND CHILLING – need to be kept cool but not chilled. HOME – very low as often not cooked. Green beans AGRICULTURE – low if grown in the right conditions but not if grown in hothouses. MANUFACTURING AND PROCESSING – low again. TRANSPORT – low if local and seasonal, but high if air-freighted from far away. RETAIL AND CHILLING – low if grown locally, but beans do need to be kept cool. HOME – low as they don’t need a lot of cooking. www.lowcarbonliving.org.uk Fairtrade: this is frequently discussed at this point. Green beans are often air-freighted from Kenya and other developing countries. People may make choices based on factors other than the environmental impact – they may wish to support farmers in developing countries, for example – when buying food. Generally, Fairtrade food has been grown carefully to high environmental standards. Often crops are farmed by hand rather than through mechanised farming, so CO2 emissions are minimised during the growing stage. The vast majority of Fairtrade items are shipped rather than air-freighted. When buying fruit and vegetables which aren’t in season in the UK, the following rule of thumb useful. If it has come from a place where, if you plant it as a seed, the crop ‘just grows’, it’s likely to have a lower impact on the environment than if it comes from a place where it requires hothouse treatment. This is usually true even if the fruit or veg in question has had to travel long distances (as long as this has been mostly by ship). Beef and chickpeas Not all meat-eaters would happily replace beef with chickpeas on every occasion, but for one meal a week then this comparison may help. There are some useful resources at the Carbon Friendly Food website (http://www.climatefriendlyfood.org.uk/), including a very helpful menu planner. This allows you to enter foods – even meals – to calculate their carbon footprint. Their figures for the carbon footprint of food items are measured differently from those in ‘How bad are bananas?’ as they calculate the figure only up to the regional distribution centre. This means that the figures don’t include all the transport, retail and home parts of the food supply chain journey. However, the figures appear to be roughly equivalent. Beef AGRICULTURE – high. Because cows are ruminants they produce methane gas which contributes significantly to global warming. MANUFACTURING AND PROCESSING – moderate, as the meat will need to be butchered and chilled. TRANSPORT – again, needs be chilled and may travel long distances. RETAIL AND CHILLING – will be chilled or frozen. HOME – will need to be cooked, so medium. Chickpeas AGRICULTURE – low. MANUFACTURING AND PROCESSING – medium if canned, low if dried. TRANSPORT – medium if canned as cans are bulky, low if dried. RETAIL AND CHILLING – low, as do not need to be chilled. HOME – low if canned, medium to high if dried. NB using a pressure cooker saves quite a lot of energy. Figures from the Climate Friendly Food website suggest that, up to the retail distribution centre, the figure for beef is 12kg CO2e per 1kg meat; the figure for 1kg of chickpeas is around 1kg CO2e. Although many people are happy to commit to one evening meal a week that doesn’t involve meat or cheese, often lunch can be more of a problem. Remind participants that hummous, eggs and fish can be used for sandwiches or salads, while baked potatoes and baked beans or soups are often a good choice at weekends. Beer and Wine Beer AGRICULTURE – Medium About a third of the emissions for a pint of beer come from the raw ingredients. MANUFACTURING AND PROCESSING – medium. Purists may not like it, but cans, as long as they are recycled afterwards, are better than bottles. TRANSPORT – Low if from a local micro-brewery, high if bottled and from another continent. Often beer will travel from bigger breweries to a distribution centre, and then back again to local supermarkets. RETAIL AND CHILLING – Low to medium. Low if not chilled otherwise medium. www.lowcarbonliving.org.uk HOME – low, unless chilled. Wine AGRICULTURE – Medium. About a third of the emissions come from production, as this involves fertilisers. MANUFACTURING AND PROCESSING – medium. Although purists may not like it, wine in boxes will have a lower figure than wine in bottles. This is because the impact of both the production of the boxes and the transportation will be lower. TRANSPORT – The shorter the distance the wine has travelled, the lower the figure. In this case it is just that simple! RETAIL AND CHILLING – Similar to beer – ie Low to medium. HOME – low, unless chilled. Because the alcohol content of wine is greater than that of beer generally (and therefore the quantity consumed is generally lower), wine is a very slightly more carbon-friendly alcoholic drink, but there’s not much in it. Beer (per pint) Wine (per bottle) 300g CO2e locally-brewed cask ale at the pub 400g CO2e from a carton, with few road miles 500g CO2e local bottled beer from the shop or a pint of foreign beer in a pub 1,040g CO2e average 900g CO2e bottled beer from the shop, extensively transported 1,500g CO2e over-elaborate bottles, transported for thousands of miles by road All figures are from How bad are bananas? by Mike Berners Lee. This activity illustrates (at least) these points: It’s complicated! – unlike, say, insulation which is relatively easy to understand. Meat, especially beef and lamb, are so high because of ‘enteric fermentation’ (or belching and farting). If people are unclear about this, now would be a good time to explain it. Including the idea of land use change makes the explanation clearer. Food miles are not always the most significant part of an item of food’s CO2e figure. ACTIVITY 2: ‘GOOD CRUMBLE/BAD CRUMBLE’ This activity involves sorting the ingredients for a crumble into a ‘good’ crumble and a ‘bad’ crumble. Bring along the following ingredients: Two flours: one grown and milled in the UK (eg from the Co-op) and one organic sourced from more than one country (eg Marks & Spencer). Check the label if you are in doubt. Two butters: usually a British butter and Anchor butter from New Zealand. There may be some discussion about this, as cows in New Zealand are generally grass-fed out of doors. This has a lower carbon footprint than rearing grain-fed cows indoors, as is the case – at least in the winter – in the UK. Sugar: for example, a Fairtrade unbleached (possibly organic) caster sugar and a British beet sugar. In this case it is not clear which has a higher carbon footprint. Some evidence suggests that sugar beet requires fewer resources (particularly water) to grow, but needs much higher post-harvest processing, making it a less good choice. In this case, it is probably okay to go with what tastes best! Two fruits: when rhubarb is in season (roughly Feb/March to June/July) bring some rhubarb (homegrown if possible) and some UK Bramley cooking apples. During the rhubarb season, UK apples will have been in cold store for several months and so will have a much higher carbon footprint. In other months for the ‘good’ crumble you could consider using UK plums (August to October), gooseberries (June/July) or apples (October to January). For the ‘bad’ crumble you could look for any unseasonal fruit that has travelled a long distance. Marks & Spencer helpfully puts a picture of an airplane on its air-freighted food. www.lowcarbonliving.org.uk This activity illustrates several points: The importance of seasonality. How ‘food miles’ can be misleading. For example, the Bramley apples will probably not have travelled a long distance but will have a high carbon footprint because of the cold storage. The difficulty of making a judgement: in the case of sugar, for example, the measurements are complicated. A comparison of sugar beet and sugar cane in Morocco1 finds that production of sugar cane results in fewer greenhouse gas emissions than sugar beet. Less clear is the impact of locally-produced sugar beet sugar versus sugar cane sugar from Mauritius! In the case of flour, locally-sourced is definitely better. One bag of organic flour often contains flour from many countries and will have generated far more CO2 emissions in its journey to the supermarket than the locally-grown version. Make sure you read the labels. FIND OUT MORE There are lots of helpful resources where you can find out more about this complicated issue! The Love Food Hate Waste website (http://www.lovefoodhatewaste.com/) and Carbon Friendly Food http://www.climatefriendlyfood.org.uk/ have lots of helpful information. This work is part of the Low Carbon Living Toolkit and is licensed under a Creative Commons AttributionnonCommercial-ShareAlike 3.0 Unported License. If you have any questions or tips to suggest please email them to us at lowcarbon@hotmail.co.uk v1.1 06/11 Whilst we have made every attempt to ensure the accuracy of this leaflet, this information should not be relied upon as a substitute for formal advice. LCWO will not be responsible for any loss, however arising, from the use of, or reliance on this information. Low Carbon West Oxford is a registered charity 1135225. 1 http://www.greenrationbook.org.uk/resources/footprints-sugar-production/ [Accessed 16 September 2011] www.lowcarbonliving.org.uk www.lowcarbonliving.org.uk
