Supplementary Information (doc 89K)
advertisement
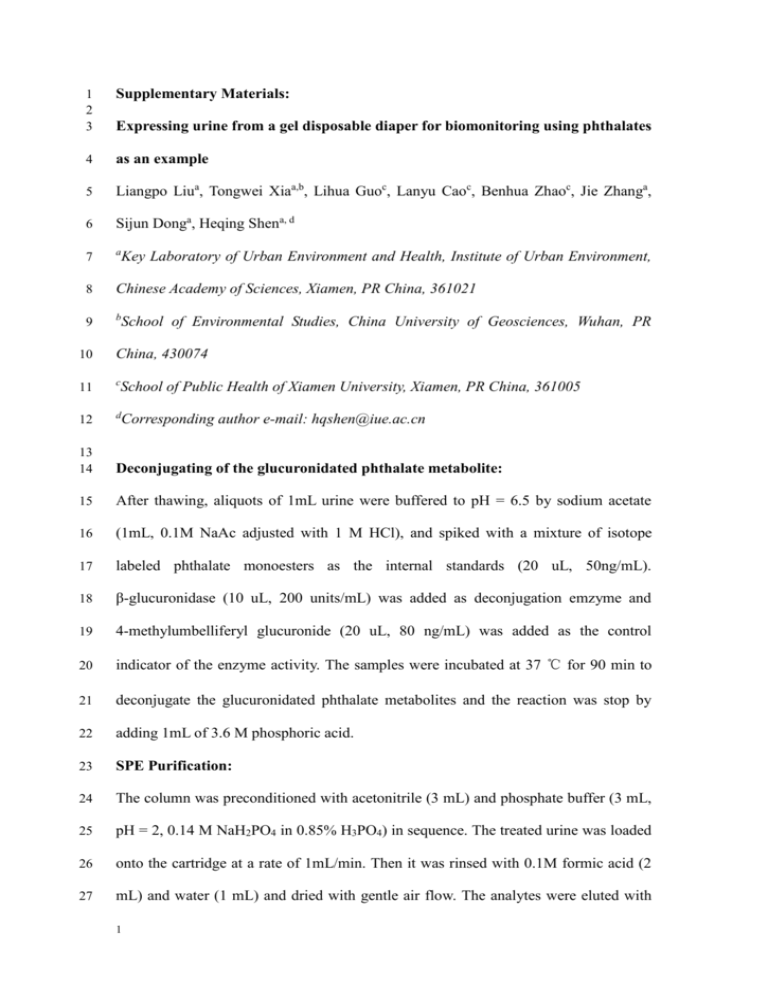
1 2 3 Supplementary Materials: 4 as an example 5 Liangpo Liua, Tongwei Xiaa,b, Lihua Guoc, Lanyu Caoc, Benhua Zhaoc, Jie Zhanga, 6 Sijun Donga, Heqing Shena, d 7 a 8 Chinese Academy of Sciences, Xiamen, PR China, 361021 9 b Expressing urine from a gel disposable diaper for biomonitoring using phthalates Key Laboratory of Urban Environment and Health, Institute of Urban Environment, School of Environmental Studies, China University of Geosciences, Wuhan, PR 10 China, 430074 11 c 12 d School of Public Health of Xiamen University, Xiamen, PR China, 361005 Corresponding author e-mail: hqshen@iue.ac.cn 13 14 Deconjugating of the glucuronidated phthalate metabolite: 15 After thawing, aliquots of 1mL urine were buffered to pH = 6.5 by sodium acetate 16 (1mL, 0.1M NaAc adjusted with 1 M HCl), and spiked with a mixture of isotope 17 labeled phthalate monoesters as the internal standards (20 uL, 50ng/mL). 18 β-glucuronidase (10 uL, 200 units/mL) was added as deconjugation emzyme and 19 4-methylumbelliferyl glucuronide (20 uL, 80 ng/mL) was added as the control 20 indicator of the enzyme activity. The samples were incubated at 37 ℃ for 90 min to 21 deconjugate the glucuronidated phthalate metabolites and the reaction was stop by 22 adding 1mL of 3.6 M phosphoric acid. 23 SPE Purification: 24 The column was preconditioned with acetonitrile (3 mL) and phosphate buffer (3 mL, 25 pH = 2, 0.14 M NaH2PO4 in 0.85% H3PO4) in sequence. The treated urine was loaded 26 onto the cartridge at a rate of 1mL/min. Then it was rinsed with 0.1M formic acid (2 27 mL) and water (1 mL) and dried with gentle air flow. The analytes were eluted with 1 28 acetonitrile (3 mL) followed by ethyl acetate (2 mL) at 1mL/min. The eluate was 29 evaporated to dryness under a gentle stream of nitrogen at 45 ℃ and the dried residue 30 was resuspended in 200 uL of 60% acetonitrile (0.1% acetic acid) for the further 31 analysis. 32 HPLC-ESI-MS/MS analysis: 33 The target compounds were separated by the LC-20A prominence (Shimadzu, Kyoto, 34 Japan) high-performance liquid chromatography (HPLC) equipped with the 35 Phenomenex® (Torrance, CA, USA) guard column (Phenyl, 4.0 mm × 2.0 mm 36 internal diameter) and separation column (Luna Phenyl-hexyl, 100 mm2.0 mm 37 internal diameter, 3.0 um particle size). Mobile phase A was 0.1% acetic acid in water 38 and B was 0.1% acetic acid in acetonitrile. Table S1 shows the HPLC gradient 39 program. The mobile phase flow rate was set at 0.25 mL/min, and the column 40 temperature was set at 30 ℃. The total run time for each injection was 20 min and the 41 injection volume was 20 uL. 42 The target compounds were ionized by electrospray ionization (ESI) and detected by 43 the tandem mass spectrometry (MS/MS) (Applied Biosystems, Concord, Ontario, 44 Canada). The mass specific detection was achieved using a MDS Sciex 3200 Q TRAP 45 triple quadrupole linear ion trap mass spectrometer equipped with a TurboIonSpray 46 electrospray ionization (ESI) source and Analyst Software version 1.5 (Applied 47 Biosystems, Concord, Ontario, Canada). ESI-MS/MS was performed at unit mass 48 resolution in multiple reaction monitoring (MRM) under the negative ion mode with 49 the following parameters: source temperature (TEM) 550 ℃, ion spray voltage (IS) 50 -4500 V, curtain gas (CUR) 10 psi (46 kPa of nitrogen), ion source gas 1 (GS1) 40 psi 51 (276 kPa of nitrogen), ion source gas 2 (GS2) 40 psi (276 kPa of nitrogen), collision 52 gas pressure (nitrogen) medium (corresponds to value of 3 (arbitrary scale of 1–12)), 2 53 and dwell time per channel 50 ms. Optimization of the compound-dependent MS/MS 54 parameters was performed with phthalate metabolites standards via direct injection 55 into the mass spectrometer using a syringe pump (MDS Sciex) at a flow rate of 10 56 uL/min. Optimal settings for compound-dependent MS/MS parameters are shown in 57 Table S2. 58 The Absolute Recovery of SPE Extraction: 59 The phthalate metabolite’s absolute recoveries during SPE extraction were calculated 60 (Table S3). Considering the background analytes in the urine, we used the labeled 61 internal standard to track the SPE recovery instead of the native compounds 62 (assuming the labeled internal standards are 100% pure). One of the paired spiking 63 samples was added the labeled internal standards before SPE (Concbefore); the other 64 was added the labeled internal standards after SPE (Concafter). The SPE recovery was 65 calculated as: SPE recovery = (Concafter/Concbefore) 100% 66 67 Because of the recoveries in the urine expression step are close to hundred percent for 68 the analytes, the absolute recoveries of the whole sample preparation procedure 69 should be comparable with the reported SPE extraction recoveries for adult urine 70 analysis (Liu et al., 2011; Silva et al., 2004). In case of the low SPE recovery, the 71 stable isotope-labeled compounds as internal standards had been used to correct the 72 possible matrix effects and to improve method accuracy and precision. 73 74 75 76 Reference: 1. Liu, L., Bao, H., Liu, F., Zhang, J., and Shen, H. Phthalates exposure of the 77 Chinese reproductive age couples and their effect on male semen quality, a 78 primary study. Environ Int 2011 (doi:10.1016/j.envint.2011.04.05). 79 2. Silva, M.J., Slakman, A.R., Reidy, J.A., Preau Jr, J.L., Herbert, A.R., and Calafat, 3 80 A.M., et al. Analysis of human urine for fifteen phthalate metabolites using 81 automated solid-phase extraction. J Chromatogr B 2004: 805: 161-167. 82 83 84 85 86 87 Table S1. Mobile Phase Gradient Programa a Time (min) 0 0.3 1.3 8.0 12 12.5 13.5 14.0 20.0 A (%) 5 5 40 20 20 0 0 5 5 B (%) 95 95 60 80 80 100 100 95 5 A: 0.1% acetic acid in water and B: 0.1% acetic acid in acetonitrile. Table S2. Transitions and MS/MS conditions for each analyte Analytes Parent (Q1) Daughter (Q3) Dwell time DP EP CEP CE CXP MMP 179.0 107.0 50.0 -30.0 -7.0 -10.0 -15.0 0.0 MMP-13C4 183.0 110.0 50.0 -33.0 -7.0 -17.7 -14.0 0.0 MEP 193.0 121.0 50.0 -30.0 -7.0 -10.0 -16.0 0.0 MEP- C4 197.0 79.0 50.0 -33.0 -7.0 -18.3 -33.0 0.0 MBP 221.0 77.0 50.0 -30.0 -7.0 -12.0 -20.0 0.0 MBP-13C4 225.0 79.0 50.0 -35.0 -7.0 -19.5 -28.0 0.0 MBzP 255.0 107.0 50.0 -30.0 -7.0 -15.0 -19.0 0.0 MBzP-13C4 259.0 107.0 50.0 -35.0 -7.0 -20.0 -21.0 0.0 MEHP 277.0 134.0 50.0 -30.0 -7.0 -15.0 -22.0 0.0 MEHP-13C4 281.0 137.0 50.0 -45.0 -7.0 -21.8 -22.0 0.0 MEOHP 291.0 121.0 50.0 -40.0 -4.0 -15.0 -35.0 0.0 MEOHP-13C4 295.0 124.0 50.0 -36.0 -7.0 -22.4 -27.0 0.0 13 88 89 90 91 92 93 DP: declustering potential [V]; EP: entrance potential [V]; CEP: cell entrance potential [V]; CE: collision energy [V]; CXP: cell exit potential [V]. Table S3. The phthalate metabolite’s absolute recoveries (%) in SPE extraction step (duplicate results) Metabolites 30 ng/ml (Mean [SD]) MMP Concafter 31.6 (1.00) Concbefore 34.1 (0.04) MEP 26.9 (0.63) MBP 29.2 (1.12) MBzP 90 ng/ml (Mean [SD]) Mean Recovery 92.5 Concafter 99.8 (3.40) 32.1 (0.76) 83.8 27.8 (1.60) 105.0 29.0 (0.14) 32.7 (0.14) 88.7 MEHP 21.0 (0.59) 19.0 (0.64) MEOHP 32.5 (2.26) 28.7 (1.98) 94 4 Concbefore 92.3 ( 3.32) Mean Recovery 108.2 100.1 (2.19) 87.4 (1.89) 114.5 97.0 (5.28) 101.7 (6.33) 95.4 107 (1.10) 85.1 (0.28) 125.7 110.5 87.0 (2.57) 82.7 (2.62) 105.2 113.2 100.1 (6.86) 93.4 (6.43) 107.2
