Name - Images
advertisement
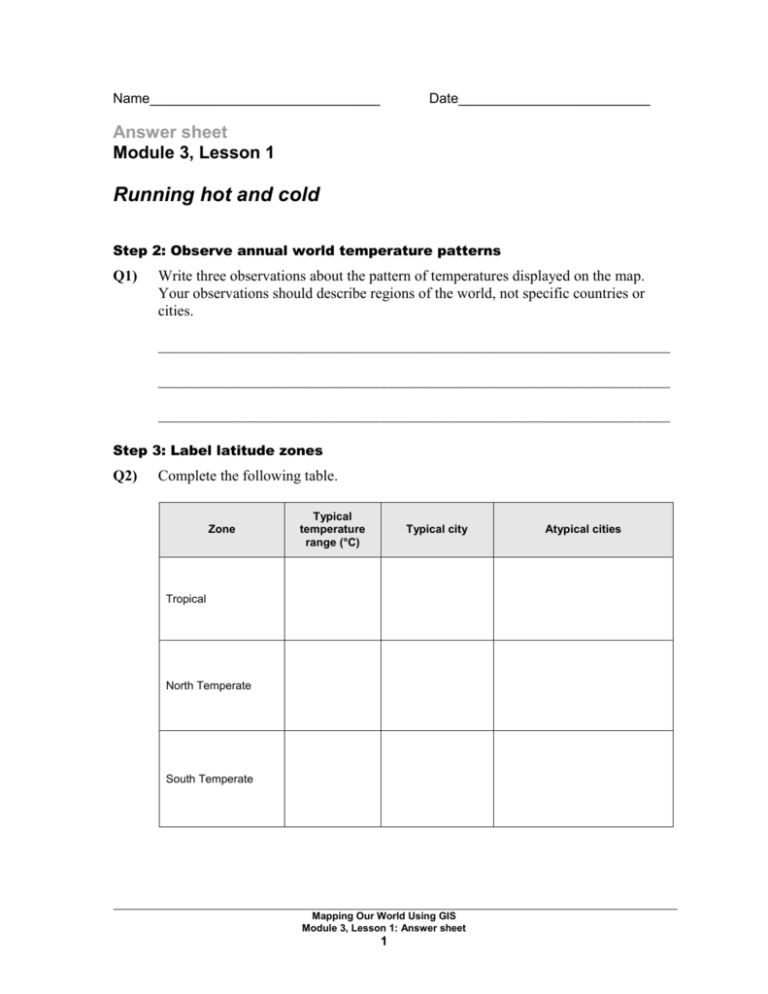
Name______________________________ Date_________________________ Answer sheet Module 3, Lesson 1 Running hot and cold Step 2: Observe annual world temperature patterns Q1) Write three observations about the pattern of temperatures displayed on the map. Your observations should describe regions of the world, not specific countries or cities. ____________________________________________________________________ ____________________________________________________________________ ____________________________________________________________________ Step 3: Label latitude zones Q2) Complete the following table. Zone Typical temperature range (°C) Typical city Tropical North Temperate South Temperate Mapping Our World Using GIS Module 3, Lesson 1: Answer sheet 1 Atypical cities Q3) Why do you think there aren’t any major cities in the North or South Polar Zones? ____________________________________________________________________ ____________________________________________________________________ ____________________________________________________________________ Q4) How is the North Temperate Zone different from the South Temperate Zone? ____________________________________________________________________ ____________________________________________________________________ ____________________________________________________________________ Step 4: Observe climate distribution Q5) Complete the following table. Zone(s) Characteristic climate(s) Tropical Temperate Polar Q6) Which zone has the greatest number of climates? _____________________________ Q7) Give an example of a city in each of the following climate zones: Arid ________________________________________________________________ Tropical Wet _________________________________________________________ Tropical Dry _________________________________________________________ Humid Subtropical ____________________________________________________ Mediterranean ________________________________________________________ Marine ______________________________________________________________ Mapping Our World Using GIS Module 3, Lesson 1: Answer sheet 2 Humid Continental ____________________________________________________ Subarctic ____________________________________________________________ Highland ____________________________________________________________ Q8) Record the new name of the map document and its new location. Document ___________________________________________________________ (Example: ABC_Mod3Les1.mxd) Location ____________________________________________________________ (Example: C:\Student\ABC) Step 5: Observe monthly temperature patterns in the Northern Hemisphere Q9) What does the graph show now? __________________________________________ Q10) What city is highlighted on the map? ______________________________________ Q11) What does the graph show now? __________________________________________ Q12) What city or cities are highlighted on the map? ______________________________ Q13) Complete the following table. City Coldest months Lowest temperature (°C) Hottest months Highest temperature (°C) Temperature range over 12 months (°C) Boston Miami Q14) What is the name of the city? _____________________________________________ Q15) How does its monthly temperature pattern differ from Boston’s? _____________________________________________________________________ _____________________________________________________________________ Q16) What is the name of the city? _____________________________________________ Mapping Our World Using GIS Module 3, Lesson 1: Answer sheet 3 Q17) How does its monthly temperature pattern differ from Miami’s? _____________________________________________________________________ _____________________________________________________________________ Q18) Complete the following table for each of the cities displayed in the graph. City Latitude Coldest month(s) Lowest temperature (°C) Hottest month(s) Highest temperature (°C) Temperature range over 12 months Boston Miami Q19) Based on the information displayed in the graph, the map, and the table in Q18, formulate a hypothesis about how the monthly temperature patterns change as latitude increases. _____________________________________________________________________ _____________________________________________________________________ Step 6: Test your hypothesis Q20) Complete the following table. City Latitude Stockholm Mapping Our World Using GIS Module 3, Lesson 1: Answer sheet 4 Q21) Does the data for the cities you selected confirm or dispute your hypothesis in Q19? Explain. _____________________________________________________________ _____________________________________________________________________ _____________________________________________________________________ Step 7: Analyze temperature patterns in the Southern Hemisphere Q22) Complete the following table. City Latitude (°) Coldest month(s) Lowest temperature (°C) Hottest month(s) Highest temperature (°C) Temperature range over 12 months Darwin Q23) Compare the monthly temperature patterns in the Southern Hemisphere to those in the Northern Hemisphere. _____________________________________________________________________ _____________________________________________________________________ _____________________________________________________________________ Q24) Formulate a hypothesis about the relationship between monthly temperature patterns and increases in latitude in the Southern Hemisphere. _____________________________________________________________________ _____________________________________________________________________ _____________________________________________________________________ Mapping Our World Using GIS Module 3, Lesson 1: Answer sheet 5 Step 8: Test your hypothesis for the Southern Hemisphere Q25) Complete the following table. City Latitude (°) Cape Town Q26) Does the data for the cities you selected confirm or dispute your hypothesis about how latitude affects monthly temperature patterns in the Southern Hemisphere? Explain. _____________________________________________________________ _____________________________________________________________________ _____________________________________________________________________ _____________________________________________________________________ Step 9: Investigate the ocean’s influence on temperature Q27) In which Canadian city would you experience the coldest winter temperatures? _____________________________________________________________________ Q28) In which Canadian city would you experience the warmest winter temperatures? _____________________________________________________________________ Q29) Looking at the map, why do you think the warmest city has winter temperatures that are so much warmer than the others? _____________________________________________________________________ _____________________________________________________________________ _____________________________________________________________________ _____________________________________________________________________ _____________________________________________________________________ Mapping Our World Using GIS Module 3, Lesson 1: Answer sheet 6 Q30) Complete the following table. City Latitude (°) London Amsterdam Berlin Warsaw Kiev Q31) What do these cities have in common in terms of their locations on the earth? _____________________________________________________________________ Q32) Which two cities have the mildest temperatures? _________________________________ _____________________________________________________________________ Q33) What happens to the winter temperatures as you move from London to Kiev? _____________________________________________________________________ Q34) Why do you think some cities have milder temperatures than the others? _____________________________________________________________________ Q35) Based on your observations for Canada (Q27–Q29) and Western Europe, formulate a hypothesis about the influence of proximity to the ocean (or distance from it) on patterns of temperature. _____________________________________________________________________ _____________________________________________________________________ _____________________________________________________________________ _____________________________________________________________________ Mapping Our World Using GIS Module 3, Lesson 1: Answer sheet 7 Step 10: Investigate the impact of elevation on temperature patterns Q36) Complete the following table. City Latitude (°) Kisangani Libreville Quito Singapore Q37) What do these cities have in common in terms of their locations on the earth? _____________________________________________________________________ Q38) What temperature pattern do these four cities have in common? _____________________________________________________________________ Q39) How is Quito different from the other three? _____________________________________________________________________ _____________________________________________________________________ Q40) Since all these cities are located on or very near the equator, what other factor could explain the difference in their temperature patterns? _____________________________________________________________________ _____________________________________________________________________ Q41) Analyze the selected records and complete the following table. City Elevation (meters) Kisangani Libreville Quito Singapore Mapping Our World Using GIS Module 3, Lesson 1: Answer sheet 8 Q42) Based on your observation of temperatures along the equator and the information in the table in Q41, formulate a hypothesis about the influence of elevation on patterns of temperature. _____________________________________________________________________ _____________________________________________________________________ _____________________________________________________________________ _____________________________________________________________________ Step 11: Revisit your initial ideas Q43) Rank the 13 cities from coldest to hottest according to their average January temperatures. 1. 8. 2. 9. 3. 10. 4. 11. 5. 12. 6. 13. 7. Q44) Rank the 13 cities from hottest to coldest according to their average July temperatures. 1. 8. 2. 9. 3. 10. 4. 11. 5. 12. 6. 13. 7. Q45) Put a check mark next to the answers in Q43 and Q44 that you predicted correctly. Mapping Our World Using GIS Module 3, Lesson 1: Answer sheet 9
