Controls were healthy spouses, friends, or nonblood
advertisement
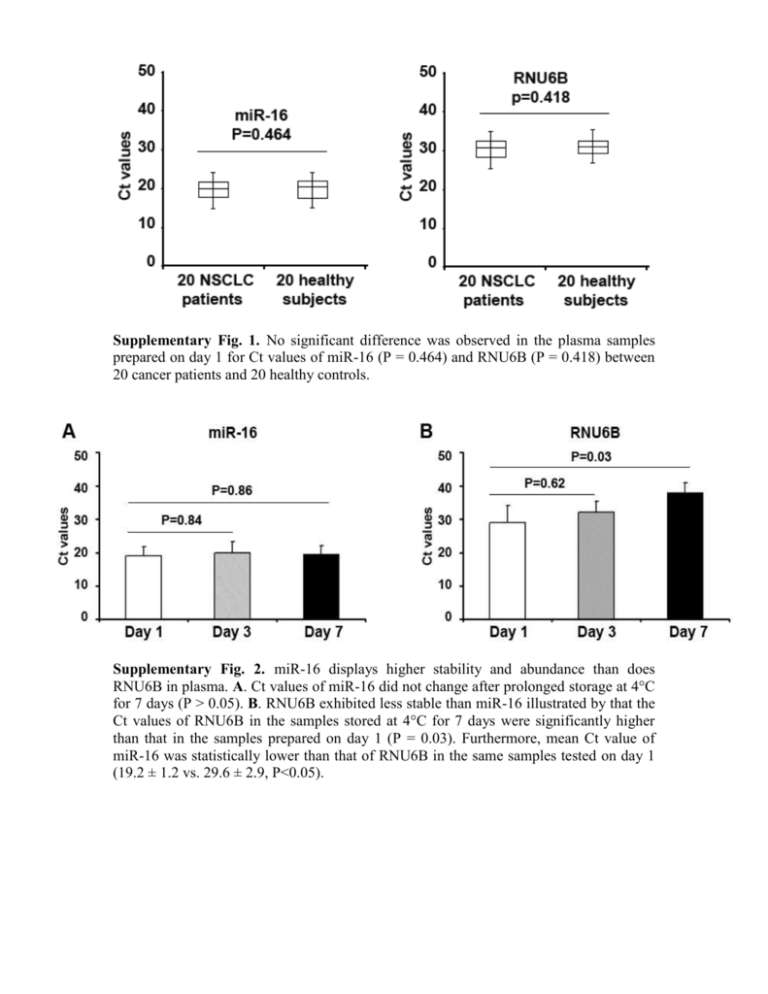
Supplementary Fig. 1. No significant difference was observed in the plasma samples prepared on day 1 for Ct values of miR-16 (P = 0.464) and RNU6B (P = 0.418) between 20 cancer patients and 20 healthy controls. Supplementary Fig. 2. miR-16 displays higher stability and abundance than does RNU6B in plasma. A. Ct values of miR-16 did not change after prolonged storage at 4°C for 7 days (P > 0.05). B. RNU6B exhibited less stable than miR-16 illustrated by that the Ct values of RNU6B in the samples stored at 4°C for 7 days were significantly higher than that in the samples prepared on day 1 (P = 0.03). Furthermore, mean Ct value of miR-16 was statistically lower than that of RNU6B in the same samples tested on day 1 (19.2 ± 1.2 vs. 29.6 ± 2.9, P<0.05). Supplementary Fig. 3. Stability of endogenous miRNAs in archived plasma samples. Aliquots of plasma specimens were stored at -20°C for 1, 3, 7, and 30 days. A. Bioanalyzer showed that there was increasing degradation of total RNA demonstrated by gradually decreased heights of 18S and 28S peaks from day 1 to day 30. B. There was no effect on expression levels of the miRNAs determined by qRT-PCR in the same specimens. The figure only shows the results for miR-21, 126, 182, 210, 486-5p, and 375. Supplementary Fig. 4. The endogenous plasma miRNAs have substantial resistance to the enzymatic cleavage of RNase A. Expressions of the miRNAs were measured in the plasma samples treated with RNase A at different concentrations and the samples without the treatment. The abundance of the miRNAs in plasma with the different treatments did not display significant difference (All P>0.05) (A-F). The figure only shows the results for miR-21, 126, 182, 210, 486-5p, and 375. However, synthesized cel-miR-238 spiked in the same specimens treated with or without RNase A was almost not detected (G). Supplementary Fig. 5. Sensitivity and dynamic range of qRT-PCT assay for quantification of synthesized cel-miR-238 in plasma. Error bars represent standard deviation to reflect the variations among the replicate measurements. Supplementary Fig. 6. QRT-PCR assay is highly specific and could discriminate miRNAs that are different members of the same human miRNA gene family, miR-486. The synthetic miR486-5p or miR-486-3p was subjected to two independent qRT-PCR reactions, where in each reaction there were PCR primers specific to only one of the two miR-486 variants. Non-specific amplification was found, however amplification only of the appropriate gene matching the specific primers was observed. Error bars represent standard deviation to reflect the variations among the replicate measurements. Supplementary Fig. 7. miRNAs are accurately and robustly measured by qRT-PCR. RNA isolated from plasma was diluted in DEPC water by ten orders of magnitude, respectively. The serially diluted RNAs served as experimental samples for measuring expression of each miRNA by qRT-PCR. There was excellent linearity between the RNA input and the Ct values for the qRT-PCR assay. The assay had a dynamic range of at least eight orders of magnitude, and was capable of detecting as few as 10 copies of miRNA per PCR reaction, and the correlation coefficient was at least 0.992 for the miRNAs tested. The figure only shows the results for miR-21, 145, 205, 375, 486-5p, and 429. Error bars represent standard deviation to reflect the variations among the replicate measurements. Supplementary table 1. Expression levels of the five miRNAs in plasma of an independent of cohort of 58 NSCLC patients and 29 healthy individuals MiRNAs 58 cancer cases 28 healthy smokers P Mean ± SD Mean ± SD miR-21 6.647 ± 2.045 0.628 ± 0.092 0.0002 * miR-182 6.783 ± 2.259 2.195 ± 0.673 0.0006 * miR-210 2.651 ± 0.772 1.126± 0.558 0.0005 * miR-126 4.598 ± 1.323 8.189 ± 2.149 0.0003 * miR-486-5p 3.659 ± 0.964 8.852 ± 2.609 0.0001 * Abbreviations: NSCLC, non-small-cell lung cancer; SD, standard deviation. * Statistical significance of expression levels of the miRNAs between NSCLC patients and healthy subjects. P < 0.05. Supplementary table 2. Capability of the five miRNAs to discriminate NSCLC patients from healthy subjects * miRNAs AUC (SE) Sensitivity % Specificity % miR-21 0.816 (0.07) 79.31 65.52 miR-486-5p 0.878 (0.05) 84.48 68.97 miR-126 0.760 (0.06) 68.97 82.76 miR-210 0.746 (0.04) 74.14 68.97 miR-182 0.662 (0.05) 51.72 75.86 * Receiver-operator characteristic (ROC) curve and the area under ROC curve (AUC) analyses were applied to determine optimal thresholds that define expression levels of the tested genes, yielding corresponding maximum sensitivity and specificity of each gene in distinguishing NSCLC from healthy individuals. Abbreviations: NSCLC, non-small-cell lung cancer; SE, standard error.
