Table: Results of FBAT analysis using an additive model
advertisement
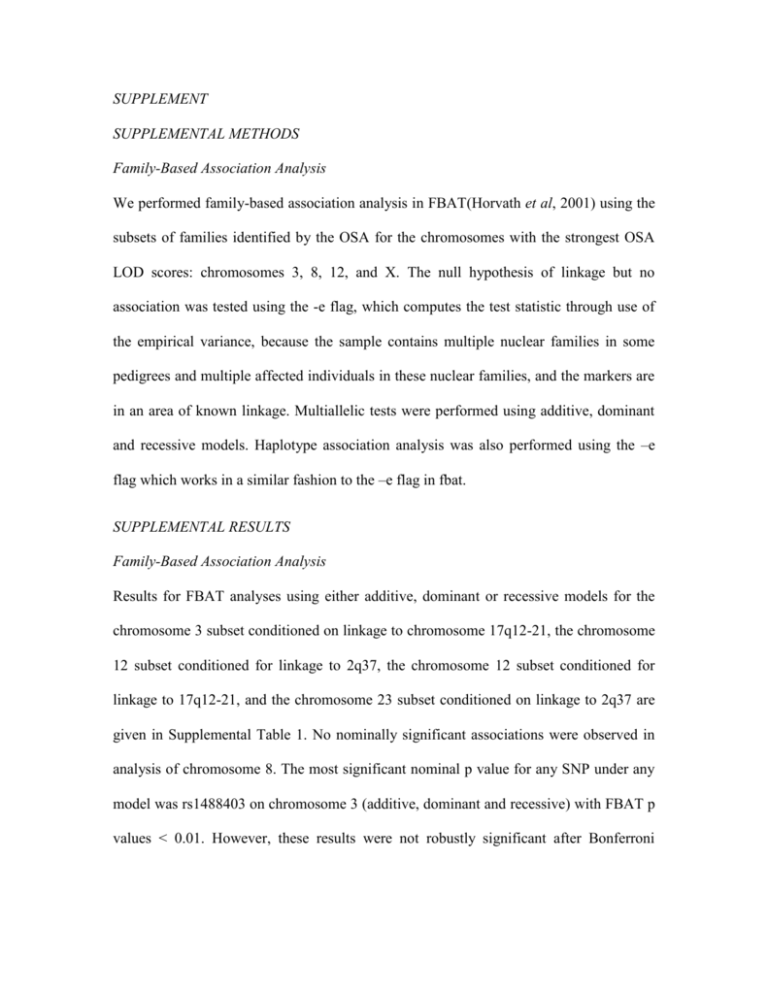
SUPPLEMENT SUPPLEMENTAL METHODS Family-Based Association Analysis We performed family-based association analysis in FBAT(Horvath et al, 2001) using the subsets of families identified by the OSA for the chromosomes with the strongest OSA LOD scores: chromosomes 3, 8, 12, and X. The null hypothesis of linkage but no association was tested using the -e flag, which computes the test statistic through use of the empirical variance, because the sample contains multiple nuclear families in some pedigrees and multiple affected individuals in these nuclear families, and the markers are in an area of known linkage. Multiallelic tests were performed using additive, dominant and recessive models. Haplotype association analysis was also performed using the –e flag which works in a similar fashion to the –e flag in fbat. SUPPLEMENTAL RESULTS Family-Based Association Analysis Results for FBAT analyses using either additive, dominant or recessive models for the chromosome 3 subset conditioned on linkage to chromosome 17q12-21, the chromosome 12 subset conditioned for linkage to 2q37, the chromosome 12 subset conditioned for linkage to 17q12-21, and the chromosome 23 subset conditioned on linkage to 2q37 are given in Supplemental Table 1. No nominally significant associations were observed in analysis of chromosome 8. The most significant nominal p value for any SNP under any model was rs1488403 on chromosome 3 (additive, dominant and recessive) with FBAT p values < 0.01. However, these results were not robustly significant after Bonferroni correction (p=6x10⁻⁵) for multiple testing. No even nominally significant results were found using the haplotypes association method. Supplement Table 1: Results of FBAT analysis using additive, dominant and recessive models Chr Marker Mb Allele 3.62 1 Allele No. frequency Families P* Gene Region† 0.008 LRRN1 Additive Model 3 rs1488403 0.387 19 (220 kb) 3 rs262180 68.43 1 0.497 21 0.009 FAM19A1 12_2 rs1064951 118.89 1 0.405 13 0.008 KDM2B 12_17 rs1846629 33.02 1 0.825 11 0.022 SYT10 (500 kb) 23 rs1869588 5.88 1 0.36 11 0.048 microRNA 651 (19 kb) Dominant Model 3 rs1488403 3.62 1 0.387 18 0.007 LRRN1 (220 kb) 3 D3S1601 189.08 11 0.074 10 0.013 LOC100129725 SPG14 CLDN1 12_2 rs1064951 118.89 2 0.595 10 0.006 KDM2B 12_2 D12S2078 124.94 6 0.334 11 0.018 IBD2 12_17 rs187991 57.01 2 0.564 11 0.011 SLC16A7 (120 kb) rs1869588 23 5.88 1 0.36 11 0.048 microRNA 651 (19 kb) Recessive Model rs1488403 3 3.62 2 0.613 18 0.007 LRRN1 (220 kb) 12_2 rs1064951 118.89 1 0.405 10 0.006 KDM2B 12_17 rs187991 57.01 1 0.436 11 0.011 SLC16A7 (120 kb) 23 rs1869588 5.88 1 0.36 11 0.048 microRNA 651 (19 kb) * After correction for multiple testing, none of these p values were significant. † Genes listed with a distance in parentheses are the nearest gene to the tested SNP, the distance given is the distance from the SNP to the 5’/3’ end of the gene.
