A genome-wide association study in male chronic
advertisement
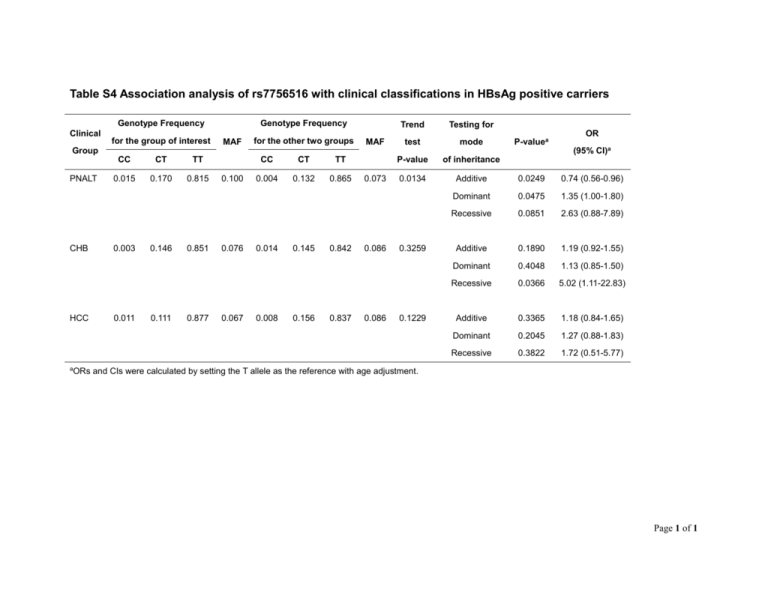
Table S4 Association analysis of rs7756516 with clinical classifications in HBsAg positive carriers Genotype Frequency Clinical for the group of interest Genotype Frequency MAF for the other two groups MAF Trend Testing for test mode P-value of inheritance 0.0134 Additive 0.0249 0.74 (0.56-0.96) Dominant 0.0475 1.35 (1.00-1.80) Recessive 0.0851 2.63 (0.88-7.89) Additive 0.1890 1.19 (0.92-1.55) Dominant 0.4048 1.13 (0.85-1.50) Recessive 0.0366 5.02 (1.11-22.83) Additive 0.3365 1.18 (0.84-1.65) Dominant 0.2045 1.27 (0.88-1.83) Recessive 0.3822 1.72 (0.51-5.77) P-valuea Group PNALT CHB HCC aORs CC CT TT 0.015 0.170 0.815 0.003 0.011 0.146 0.111 0.851 0.877 0.100 0.076 0.067 CC CT TT 0.004 0.132 0.865 0.014 0.008 0.145 0.156 0.842 0.837 0.073 0.086 0.086 0.3259 0.1229 OR (95% CI)a and CIs were calculated by setting the T allele as the reference with age adjustment. Page 1 of 1
