Predator-Prey Simulation Worksheet: Marine Biology
advertisement
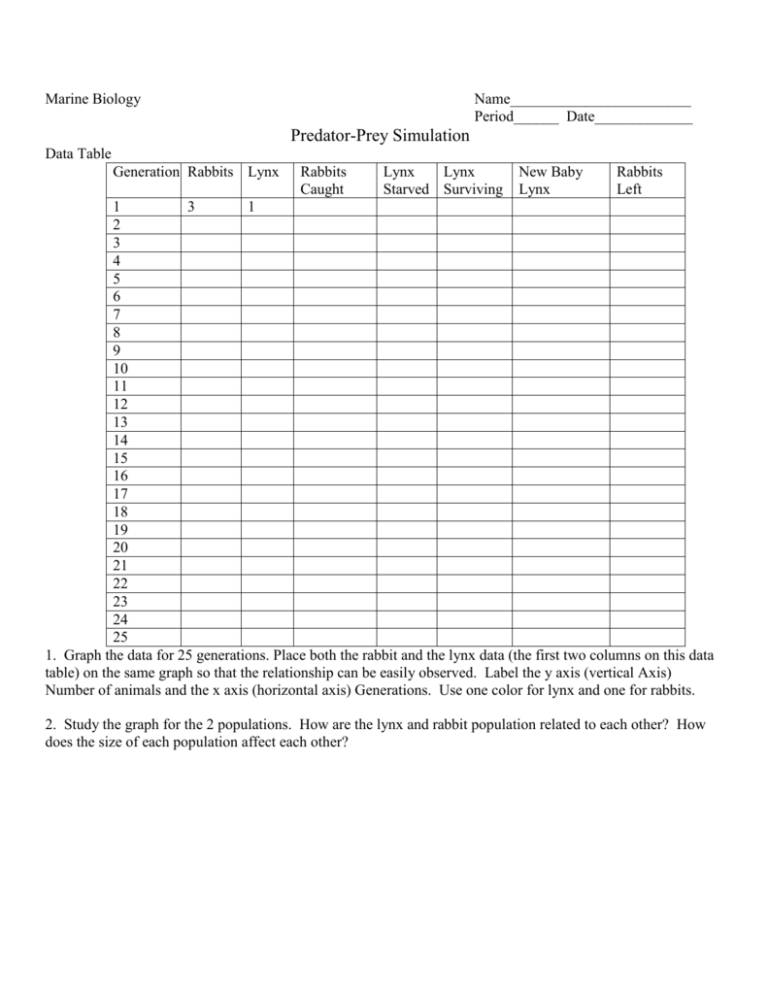
Marine Biology Name________________________ Period______ Date_____________ Predator-Prey Simulation Data Table Generation Rabbits Lynx Rabbits Caught Lynx Lynx Starved Surviving New Baby Lynx Rabbits Left 1 3 1 2 3 4 5 6 7 8 9 10 11 12 13 14 15 16 17 18 19 20 21 22 23 24 25 1. Graph the data for 25 generations. Place both the rabbit and the lynx data (the first two columns on this data table) on the same graph so that the relationship can be easily observed. Label the y axis (vertical Axis) Number of animals and the x axis (horizontal axis) Generations. Use one color for lynx and one for rabbits. 2. Study the graph for the 2 populations. How are the lynx and rabbit population related to each other? How does the size of each population affect each other? 3. Under what modifications can both populations continue to exist indefinitely? 4. In your opinion, what would happen if you introduced an additional predator, such as a coyote, which requires fewer rabbits to reproduce? 5. What would happen if you introduced another type of rabbit, one that could run faster and escape its predators? (In the same simulation, you could give the new type of rabbit a chance to escape by tossing a coin after it is caught and it go if you got heads.) Which type of rabbit would predominate after many generations of predation? 6. How does this simulation relate to the human population and its interaction with it’s environment? Are there any predator-prey relationships humans are involved in?
