dul2-z7g9990911142s01
advertisement
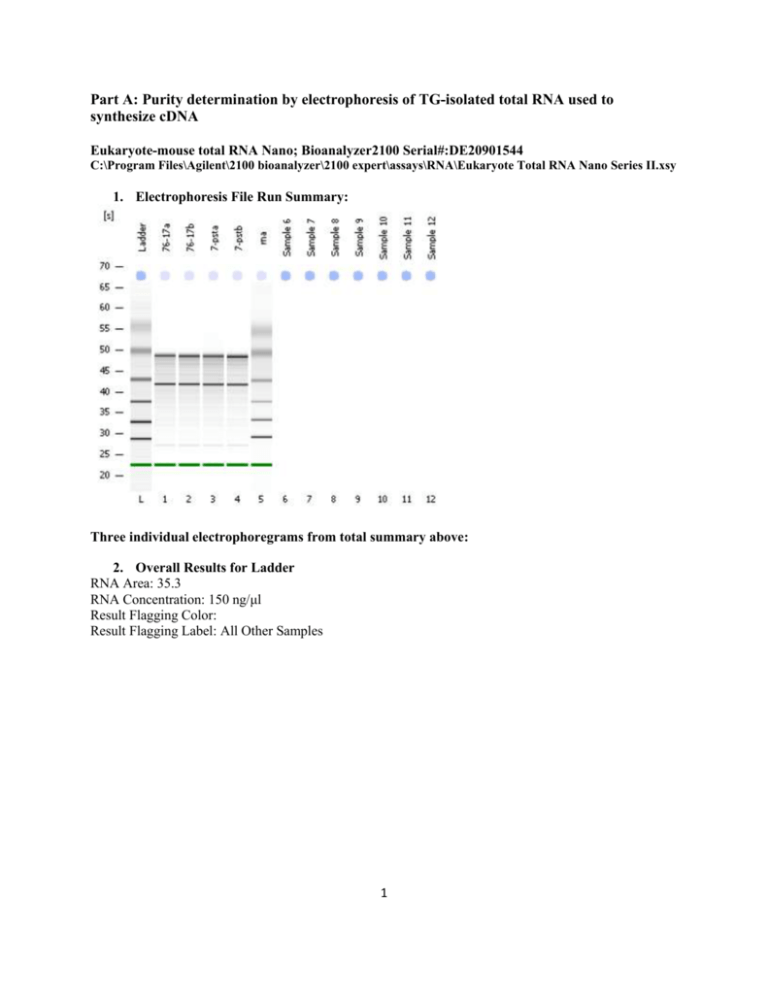
Part A: Purity determination by electrophoresis of TG-isolated total RNA used to synthesize cDNA Eukaryote-mouse total RNA Nano; Bioanalyzer2100 Serial#:DE20901544 C:\Program Files\Agilent\2100 bioanalyzer\2100 expert\assays\RNA\Eukaryote Total RNA Nano Series II.xsy 1. Electrophoresis File Run Summary: Three individual electrophoregrams from total summary above: 2. Overall Results for Ladder RNA Area: 35.3 RNA Concentration: 150 ng/μl Result Flagging Color: Result Flagging Label: All Other Samples 1 3. Overall Results for sample 1 : 76-17a (17Syn+ RNA sample) RNA Area: 364.1 RNA Concentration: 1,549 ng/μl rRNA Ratio [28s / 18s]: 1.2 RNA Integrity Number (RIN): 7.3 (B.02.03) Result Flagging Color: Result Flagging Label: RIN: 7.30 Fragment table for sample 1 : 76-17a Name Start Time [s] End Time [s] Area % of total Area 18S 40.82 42.48 52.8 14.5 28S 47.09 49.89 63.2 17.4 2 4. Overall Results for sample 4 : 7-pstb (17∆Pst RNA sample) RNA Area: 516.3 RNA Concentration: 2,196 ng/μl rRNA Ratio [28s / 18s]: 1.0 RNA Integrity Number (RIN): 7.4 (B.02.03) Result Flagging Color: Result Flagging Label: RIN: 7.40 Fragment table for sample 4 : 7-pstb Name Start Time [s] End Time [s] Area % of total Area 18S 41.00 42.41 79.8 15.5 28S 47.97 49.47 79.8 15.5 3 Part B: Example of microarray image generated by scanning in the phycoerythrin filter using a confocal laser Part C: Microarray and Data Analysis 4 Procedures for cDNA synthesis, labeling, and hybridization were carried out as described at http://www.affymetrix.com/support/technical/manual/expression_manual.affx (Affymetrix, Redwood City, CA). All experiments were performed using mouse genome 430 2.0 GeneChips as described at http://www.affymetrix.com/support/technical/byproduct.affx?product=moe43020. Briefly, 5 μg of total RNA was used for first-strand synthesis using T7-(dT)24 primer (Affymetrix) and SuperScript Double-Stranded cDNA Synthesis kit (Invitrogen). Synthesis of biotinylated-labeled cRNA was carried out using the ENZO RNA transcript labeling kit (ENZO). For overnight hybridization, 15 μg of fragmented cDNA was used in the Hybridization Oven 640, washed, stained with streptavidin-phycoerythrin using a microfluidics workstation, and scanned with the High Resolution 3000 Scanner (Affymetrix). Signal and background intensities were quantitated by pixel intensity, and expression signals were analyzed using the GeneChip Operating Software (GCOS 1.4). All array images and quality control measurements were consistent and within acceptable limits. The CEL data file from each array were imported into Genespring GX 7.1 (Agilent Technologies) and preprocessed using the robust multichip average (RMA) method and per gene normalization was applied using the median values of the control sample. The detection call metrics from the CHP files were also imported and used to filter out transcripts (20,060 transcripts, note: there are multiple probes on the chip for several genes so while there are 14,000 genes, the number of transcripts are far in excess) that were found absent in both samples. The cross-gene error model was applied. To identify up-regulated and down-regulated transcripts, genes were filtered using the volcano plot with the limit set at p<0.05 and 1.5 fold change. The 56 genes (note: all were ≥2-fold) were identified and analyzed in NetAfflx (Affymetrix). There was adjustment of p≥0.05 to identify 24 genes that were down-regulated (note: all were ≥3-fold). 5 Volcano plot: single p-value <0.05 (and not multiple values) Part D: Image of 2% agarose gel electrophoresis of samples of expressed genes in 17Syn+ versus 17∆Pst sodium butyrate induced ganglia. 6 Part E: Isolation and culture of primary trigeminal ganglia neuronal cells to determine source (infected neuronal) of histone gene activity Primary cultures were prepared from trigeminal ganglia (TG) of 6 killed female BALB/c mice. The TG were rapidly excised and dissociated in 0.25 mg/ml trypsin, 1 mg/ml collagenase and 0.2 mg/ml DNAse(Sigma–Aldrich) in F12 medium (Invitrogen, Gibco) at 37OC. To inactivate enzymes, 10% fetal calf serum and 0.125 mg/ml trypsin inhibitor (Sigma–Aldrich) were added. Cells were centrifuged at 2000 rpm for 1 minute, resuspended in F12 medium + 10% fetal calf serum and plated onto 6-well (Corning Inc, NY) some with poly-l-lysine-coated 24-mm diameter glass cover-slips at the bottom. Cells were maintained in culture for 48 h and medium removed. Fresh medium only or containing HSV-1 (17Syn+, 17∆Pst, heat killed 17Syn+, heat killed 17∆Pst) at 105 PFU/ml were added spun at 1000 rpm (spin-inoculation) for 10 minutes, incubated for 2 hours, medium removed and fresh medium added and incubated. For those wells with cover-slips, the cover-slips were recovered and cells fixed at room temperature for 25 minutes with 4% paraformaldehyde in 0.1M phosphate buffered saline and neuronal cells (surrounded mostly by glial-like cells) identified and estimated by staining with the neuronal marker ßtubulin-III with counter stain conjugated to AlexaFluor® 594 (Molecular Probes, Invitrogen) orange-red in color. Prior to fixing, the wells with cover-slips were incubated with green fluorescent protein tagged KOS to monitor HSV-1 infection of specifically neuronal cells. Generally after 48 hours the medium was removed from the cell monolayers and medium containing 1.2 mg/ml sodium butyrate with the exception of those control wells with no drug. Drug containing medium was incubated with the cells for 1 hour, cells were then washed and fresh medium added for 1 more hour to allow cells to recover. RNA was separately extracted as previously described. The cDNA was analyzed by real-time PCR in triplicate using Hist2h2be 7 primer pairs. Relative quantities of Hist2h2be RNA were normalized to host β-actin, and the results presented as percent Hist2h2be relative to the time point of 0 hour determined in vivo. 8

