4-D Photoacoustic Tomography Liangzhong Xiang, Bo Wang, Lijun
advertisement
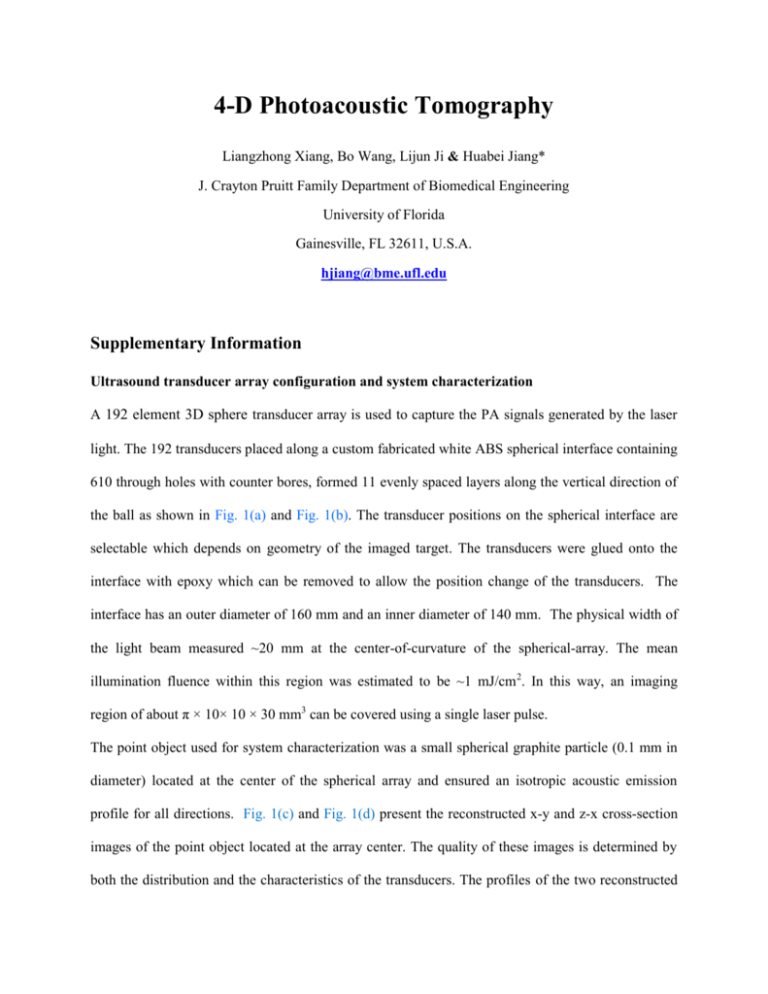
4-D Photoacoustic Tomography Liangzhong Xiang, Bo Wang, Lijun Ji & Huabei Jiang* J. Crayton Pruitt Family Department of Biomedical Engineering University of Florida Gainesville, FL 32611, U.S.A. hjiang@bme.ufl.edu Supplementary Information Ultrasound transducer array configuration and system characterization A 192 element 3D sphere transducer array is used to capture the PA signals generated by the laser light. The 192 transducers placed along a custom fabricated white ABS spherical interface containing 610 through holes with counter bores, formed 11 evenly spaced layers along the vertical direction of the ball as shown in Fig. 1(a) and Fig. 1(b). The transducer positions on the spherical interface are selectable which depends on geometry of the imaged target. The transducers were glued onto the interface with epoxy which can be removed to allow the position change of the transducers. The interface has an outer diameter of 160 mm and an inner diameter of 140 mm. The physical width of the light beam measured ~20 mm at the center-of-curvature of the spherical-array. The mean illumination fluence within this region was estimated to be ~1 mJ/cm 2. In this way, an imaging region of about π × 10× 10 × 30 mm3 can be covered using a single laser pulse. The point object used for system characterization was a small spherical graphite particle (0.1 mm in diameter) located at the center of the spherical array and ensured an isotropic acoustic emission profile for all directions. Fig. 1(c) and Fig. 1(d) present the reconstructed x-y and z-x cross-section images of the point object located at the array center. The quality of these images is determined by both the distribution and the characteristics of the transducers. The profiles of the two reconstructed images were also extracted in x and z directions, as shown in Fig. 1(e) and Fig. 1(f), respectively. The full width at half maximum (FWHM) of the profiles was measured to be 0.19 mm (x direction) for Fig. 1(c), and 0.27 mm (z direction) for Fig. 1(d), compared to the theoretical value of 0.16 mm for the 5 MHz central frequency transducer with an estimated cut off frequency of 7 MHz. For targets located away from the center of the array, the radial resolution will stay nearly the same as that for a centrally located target, while the lateral resolution will be linearly reduced with increased distance away from the array center. Figure 1 | Ultrasound transducer array configuration and system characterization. (a.) 3D schematic of the transducer distribution on a white ABS interface. (b.) Photograph of the transducer array. (c.) Reconstructed images of the point source object by the 4 D PAT system in x-y plane and (d. ) in x-z plane. (e.), (f.) are the profiles extracted in x and z directions from (c.) and (d.), respectively. Units are in mm. Photothermal therapy and temperature monitoring An integrated imaging and therapy system was assembled to acquire photoacoustic imaging during photothermal therapy in Fig.2. A 192 element spherical array transducer, with 64 parallel data acquisition system was used to capture photoacoustic transients. A Ti: Sapphire pulsed laser system operating at 810-nm wavelength, with a 10-Hz repetition rate was interfaced for photoacoustic imaging of tissue samples. A continuous wave (CW) diode laser, operating at 755 nm with a maximum power of 80mW, was used as a light source for photothermal therapy. The direction of the laser beam was orthogonal to the imaging plane. During the five-minute exposure, photoacoustic frames were recorded every 0.333 s. The captured data were stored offline for temperature processing. The experiments were performed at 25°C. Figure 2 | Diagram of the experimental setup of photothermal therapy and temperature monitoring.
